Sunday, May 20, 2012


Express Elevator to the Twelfth Floor Please~


6:18 PM EST

I gave you everything you needed last week.  I mentioned the Greece insnaity.  I stated clearly that the VIX is elevated.  I even said "Dropping below this (the 100 SMA) will change everything and open the market to much more downside..............if we cannot hold the 100 SMA on the daily chart it is likely we could go as low as DOW 12,000 before seeing a change in direction".

Well, here we are.  Almost there, DOW 12,000.  This is a big psyche number.  And we may break below that as well.  Cross your fingers, as a close below 12,000 is very bad ju-ju.  That alone could take us all the way back to DOW 10,000.

Again, I won't re-hash the news.  Last weekend we knew the Greece issue was front and center with all the drama and spill over it implies.  And when we broke the 100 SMA on the DIA, I think I heard someone yell, "LOOK OUT BELOW!"  Yes, there was some good news on the economic front of the good ole USA.  But the insanity happening in Greece is making everyone so nervous that it meant nothing.  The Market tried to bounce a couple of times, but it was a no-go.  The Bears are hitting home runs and the Bulls seem to have left the playing field.

The only thing left is to wait patiently for a reversal and BUY, BUY, BUY.  There are some great stocks out there that have fallen for no other reason than the fear that Greece is causing.  When the reversal happens, it will be a good time to pick up a few bargains.  So get busy, reiview your fav's and more.  Find those bargains, and wait for the reversal.

Supports are DIA Daily Chart 200 SMA @ 121.81, then 120.00, and 118.00 after that.  Remember not to let the talking heads get you in a duther if we pierce DOW 12,000 intra day.  It takes a CLOSE below that number to incite another leg lower.

CURRENT MARKET TRENDS
Short Term (Daily Chart) – Down
Medium Term (3 day chart) – Down
Long Term (Weekly Chart) – Sideways with down Bias (Has not Broken the 50 SMA)



Sunday, May 13, 2012


"You Just Keep Me Hanging On~  The Supremes - circa 1966

 
3:06 PM EST

This past week there has been no big sell off, no big bounce, no panic selling, no big rally.  The uncertainty seems to just ............ keep us hanging on~!  Click here for Music
 
There really is no need to re-hash all the news of the week.  There was some big news.  But the bad news did not cause a collapse, and the good news did not cause a rally.  And everything seemed so uncertain.  No one was sure if the next news bite would bring something to praise or tears.  The market likes certainty.  And there was little certainty to be found this week.  Greece, Europe. JP Morgan, unemployment, employment, blah, blah, blah, blah. 
 
Shades of Last Years "Slipping on the Greece"
 
I did want to note the news on Greece.  With all that has happened over the last few years, it seems the politicians of Greece still do not understand the dire circumstances of the country's economic situation.  Go figger!!  They are still fighting about accepting austerity measures, etc. etc.  I will be surprised if they manage to stay in the European Union.  If they do it will be a miracle.  And if they do not, it will be a disaster.  The country will go bankrupt and the people of Greece will suffer enormously.  The wave effects will have a global impact.
 
I only mention this to emphasize the intense degree of denial.  And to give a "heads up" to the situation in other countries including ours.  People, especially politicians it seems, are unable to grasp basic economic and budgeting concepts.  They seem unable to see the consequences of the decisions they make until things become cataclysmic.  And even then, as Greece's politicians and people  have illustrated, most simply "do not get it".  Where are the leaders who care about the whole rather than just themselves?  The one's that care about the country rather than just their re-election.  Just Sayin'  
 
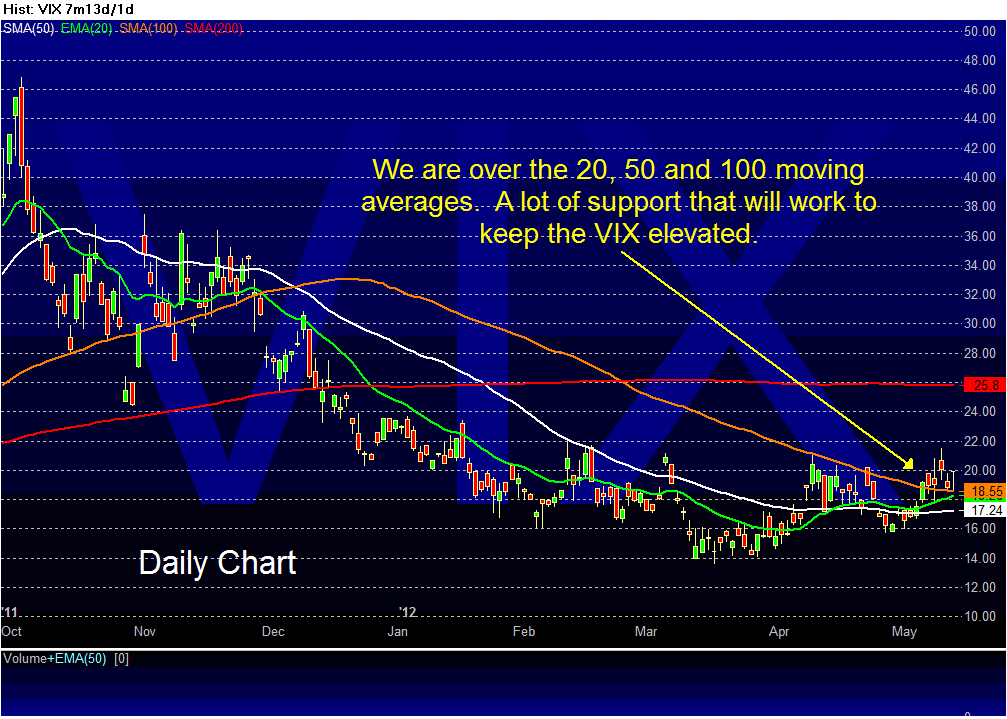
Back to the market, it's madness, and the logic of the charts.  The VIX has been pushing higher, and barely managed a close below 20.  Remember, under 20 = low volatility = good.  Over 20 = increasing volatility = bad.  Not only is the VIX barely under 20 but it appears to have made a bottom and is above it's 50, 20 and 100 SMA~!!  OUCH!  (Chart posted below)
 
The DIA.  Daily chart is holding on by the skin of it's teeth!  Closed Friday at 128.18 and the 100 SMA is at 128.16  Whew!!  Dropping below this will change everything and open the market to much more downside.  Minor supports below are 126 and 124 with good support at 122 and major support at 120.  Yes, if we cannot hold the 100 SMA on the daily chart it is likely we could go as low as DOW 12,000 before seeing a change in direction.  What?  Huh?  Yes, seems that old adage "Sell in May and Go Away" might have some validity this year.   I will be pleasantly surprised if the DIA can hold the 100 SMA next week.
 
The 3 day and weekly charts just confirm the story the Daily Chart is showing.  The 3 day chart is reiterating the Daily's major support levels of 122 and 120.  And the Weekly telling us the best support is the 120 level.    Below are the charts and the Trend table for your review.  Enjoy!
   
CURRENT MARKET TRENDS
Short Term (Daily Chart) – Down
Medium Term (3 day chart) – Sideways and looking for a bounce.
Long Term (Weekly Chart) – Sideways


Sunday, May 6, 2012


Jobs, Jobs, Jobs .....OR ....... Where did the Bulls Go, ooff, ooff, ooff  (Sing to the tune of "Who Let the Dogs Out")

8:08 PM EST

On last Sunday's commentary it was noted that the Bulls had returned and rallied price up and over the 50 SMA.  But it was also noted that things looked a bit weak, and that the burden of proof that this rally would continue was on the Bulls.  Yup, volume was noted to be on the decline as price moved up indicating fewer and fewer people willing to jump in at the rising prices.  Sadly, after a false breakout on Thursday May 3rd, the Bulls ran home leaving the Bears to lick their chops with glee!

Thursday the Bears began to take control.  But while it was a down day, some Bulls hoped for a turn around.  Then those dirty little reports about jobs came out on Friday.  And well, the Bears were chomping at the bit, just waiting for the opening bell .  When the bell went off,  "Fear Factor" began.  What?  No, different show.  This one's about being long and losing money!  The Bears went to work and chomped down on high prices all day.  One could almost hear the Bellamy Brothers (Trading Places, circa 1983) yelling "Sell! Sell! Sell!"

Not much else to say.  Monday will most likely be a continuation of Friday's dump.  And the 100 MA that coincides with the previous 2 lows should be a good support.  Better still could be the higher lows indicated by the arrows on the daily chart.  So the turn around could be about 129.50  Longs...... hold on to your hats, it could be a bumpy ride!

OK, a few charts below.  Bottom line is this.....  Support for the DIA area of 128 and Resistance at 132.50

CURRENT MARKET TRENDS
Short Term (Daily Chart) – Down
Medium Term (3 day chart) – Sideways Consolidation
Long Term (Weekly Chart) – Up