Saturday, December 31, 2011

The Bull: Biding His Time, Having a Beer, as He Awaits the Coming New Year!

11:55 AM EST 12/31/2011


The stock market ends the year with a Ho-Hum and a Sigh.  No fireworks, No Booms, No Bangs.  But the charts still favor the Bulls.  The DIA daily and weekly charts are below and annotated for your reading amusement.  We ended the year slightly above my predicted 12,000 with the DJ-30 at 12,217.  (Applause and cheers please!)  That's UP from last years close of 11,577.  Yes, I know, the press is playing up the SPY clsoing even.  It makes for a better sound bite, eh?

Damned pundits,
And talking heads.
Still yakking away,
When they should be in bed.

As we await the new trading year let me wish you all a very Happy New Year filled with profits and void of pundits and fools.  Click the link below as you read the annotated charts and enjoy a drink with me.

http://www.youtube.com/watch?v=acxnmaVTlZA

Momentum - went home
Trend  - Sideways while awaiting the Bull to begin his trek for 2012


Wednesday, December 28, 2011

Bears 2, Bulls 0

9:10 PM EST Wednesday 12/28/11


Yesterday I pointed out the inability of the indices to get over the resistance line.  (Bears 1, Bulls 0)  And today the reversal took place as the bears won the day.  No surprise to anyone reading this column.  So we're headed back down to a 12,000 DOW to finish the year.  What?  Huh?  Oh, yes, you're right!  OMG~  That is where I predicted we would end the year!!  And mark my words, if we end under that, it spells touble for 2012.

Here's the charts.  Target 20 EMA on the DIA = 120.10

Momentum = Not enough to move a snail
Trend  = Sideways

CHARTS~


Tuesday, December 27, 2011

Split Decision~? Nah

9 pm EST Tuesday 12/27/11


Today was a really boring day.  And I am still enjoying the holidays.  So what in the heck am I writing this for?  Shits and grins of course!!

Ok, here's the deal.  DIA did try to break out, but then is lost it all like a whoopee cushion losing air.  And the SPY never really broke wind.  So it's Bears by one with 3 days to go.  Seems Santa left lumps of coal for a lot of traders.

Momentum - Is there any?
Trend - Sideways

Charts below!!


Saturday, December 24, 2011

The Little Engine that Could

Yes it was looking good until........until........until we got to the resistance line. And then the little engine that could.........didn't. And volume was pitiful. True we expected poor volume so no penalties assessed.

It all falls on Monday. Reversal or rally, Monday will give us our clues. Me? I'm still out for the holidays. Merry Christmas and a Happy New Year To all.

Thursday, December 22, 2011

Bullish Inverse Head and Shoulders Alert

9:14 PM EST 12-22-11


Tonight I was just gazing at the charts and I realized there is a reverse head and shoulders formation for the DIA and the SPY.  This is a bullish formation and could give us a very nice upside rally.  But don't be too quick to jump in!  Price has to break through the resistance line.

The probable rally afterwards is calculated by taking the high after the left shoulder, and subtracting the low of the head.  The difference is added to the breakout price to get the potential upside target.

For the SPY that would be as follows in approximate numbers.
128.00 - 116 = 12.00
126.50 + 12.00 = 138.50 Target Potential

For the DIA
122.00 - 112.00 = 10.00
122.50 + 10.00 = 132.50 Target Potential


Look for Volume and Pace on the breakout to avoid false moves.  And yet, this will most likely occur during a holiday week where volume is poor historically.  It will be a difficult call for each of us to make.

Personally I am most likely going to watch from the sidelines, or not at all, as I enjoy the holidays.  SPY and DIA charts below.  Happy Trading!!

Momentum - Up
Trend - Sideways

Merry Christmas to all and a Hapy New Year~!


Wednesday, December 21, 2011

Baa-Humbug~! Ebenezer Scrooge, circa 1843 (Charles Dickens's novel, A Christmas Carol)

7:38 AM EST December 21, 2011

Yes, I said it.  When it comes to the market I'm feeling a bit "Scrooge-like".  Except I won't be having any dreams nor will I be changing my mind and giving money away.  Ba-Humbug!!

Yes, it's been over a week since I have written here.  I just got tired of saying the same thing over and over as the market churned over and over.  And it's still churning!

Feels like an old song by the Byrds, originally written by Pete Seeger in 1959

To every index - Churn, Churn, Churn
There is a pattern  - Churn, Churn, Churn
And the Dow will end the year....at twelve thousand.

OK, ok, ok, so there's a few edits by moi~  Euroland, sudden news of good things in real estate (a likely anomaly), sanctimonious Congressmen in the House (and everywhere else) that only care for headlines and themselves, an ineffective President (awwww, can't you guys play nice nice?  Come on, we can find the middle ground, pleaseeeeeeee) and an election year a coming.  Yea, I'm not seeing the love here people!

Yes, yes, getting off topic.  Ok, the charts.  Churn, Churn, Churn.  We are still stuck in the middle of the support and resistance levels.  And I don't see that changing before the end of this year.  Yes, the Santa Claus rally could still happen.  For the record it technically encompasses the time frame around Christmas and New Years, so it's possible.  "Shyeah, and monkeys might fly out of my butt!"  Wayne, Wayne's World (Mike Myers, circa 1992)

Momentum - Don't really care
Trend  - Sideways
Charts - DIA daily and weekly, SPY daily


Tuesday, December 13, 2011

"Hold.......Hold.......Hold......." - William Wallace, Braveheart, Circa 1995

8:00 PM EST

Today all eyes were on the FED.  And when all was said and done we heard what we have knownin our hearts all along.  Things are improving ever so slightly here in the US.  No new Fed Action.  And Europe is a mess and could affect our recovery.  DUH!!  And it took the best of the best in financial brain power to tell us this.

And just what happened when the genius of Wall street heard this astounding news?  TANK!  Yup, look at an intraday chart and note the time of the TANK.  2PM.  Right on que.  It was as if no one really knew that Europe was still a mess.  Why wasn't this already baked in the pie?

So now we find ourselves in with WIlliam Wallace.  That famous scene where his army is ready to fight the army of Longshanks, the evil King of England.  The "Heavy Horse" are released, and the mounted soldiers gallop forward, faster and faster.  As they get closer and closer, Wallace's army (ready to lift those very long spears), waits and we hear Wallace yelling "Hold.......Hold.......Hold...."  Can you hear him?  Can you see him?

Good, because his kinsman are muttering that same sentiment and if you are long, you should be repeating it as well.  Hold.....Hold......Hold......Hold that support!  Hold.....Hold.....Hold.....SPY hold that 50 SMA!  Hold.....Hold.....Hold..... DIA hold that 200 SMA

Otherwise.......well..... let's not think about the potential downside.  It won't matter as I think we will end the year a hair above DOW 12,000

Possible bounce off support tomorrow.

Momentum - Down
Trend - Sideways


The Charts


Monday, December 12, 2011

Ahhhh, the Wonders of a Weekend~

8:03 PM EST


Seems traders had a chance to sit back and muddle about the Euroland Agreements this weekend.  Amazing what can change when reality sinks in.  Monday morning they awoke wondering how Europe would ever implement such a difficult task?  Ohhhhhh, noooooo!  How will they?  How can they?  ACKKK! (Courtesy of Bill the Cat)  So down we go!!

This market is definately Bipolar and needs some Lithium ASAP!  Is there a Psychiatrist in the house?

Not posting the charts tonight as it's nothing new.  The Spy is still fighting the resistance of the 200 SMA and has the 20 SMA for support.  The DIA has it's resistance line and is bouncing between 122.00 and 122.50

No changes in Momentum or Trend.

Sunday, December 11, 2011

Much Ado About Nothing - William Shakespeare, circa 1600's

1:02 PM


Yup, seems everyone is all excited about Friday's news from Euroland.  Yet looking at the charts one has to wonder "why"?  Yes, Euroland agreed on something.  But without Britian?  Really?  REALLY?  The biggest wonder of it all was that Euroland leaders/politicians agreed on something.  Well, everyone but BRITAIN!

And what do the charts proclaim?  Much Ado About Nothing!  Thursday, the overhead resistance proved too much for the averages and they pulled back.  Friday, with all the magnificent news from Euroland AND hearing Consumer Confidence was once again higher.........we bounced back to the resistance line.  Yee haw and Whoopee doodles!!

NOTHING has really changed.  We are still bouncing along, hitting resistance and finding that it is simply too strong to penetrate.  The good news is that the averages continue to hit resistance again and again and again.  When a wall is hit over and over and over, it crumbles sooner or later.  Well, at least most of the time!!  But, when it does crumble, the forces usually pile through.

Think of the Medevil army that finally punches thru the castle gate.  After numerous attempts, the castle gate finally gives way.  And damned if those soldiers don't pile thru, overwhelming the castle guard.  At least that's how it goes in the movies!!  LOL

So...... if and when this resistance level is penetrated, there is a good chance it will be a strong punch upwards, potentially lasting for more than just a day or two.  Perhaps setting the stage for a new rally.  So keep your powder dry, be patient, and pounce when it happens.  Naturally, beware of false breakouts.  Remember too, that sometimes the Knights fail to break down the castle gate and turn tail, running home to safety.  It happens!

Momentum - Stalled
Trend - Sideways


The CHARTS - daily DIA and SPY


Wednesday, December 7, 2011

Viva La Resistance~

8:41 PM EST


No, it's not WW II and the French Resistance!  It's the latest Bear Cry!  Viva La Resistance!

The SPY has been trying hard to break the 200 SMA.  It has tried for 3 days and has not deceidedly made the move.  The DIA has had it's own little battle with it's resistance line at 122  And it too has not made a strong move, but has also made 3 separate attempts.  Will the fouth time be a "charm".  Could be!  Should be!  Especially since both closed just a hair above the resistance line.  Hence, both charts are looking good for another move up.  They have had a few days of consolidation.  They had an increse in volume today.  So unless there's bad news tomorrow we could see a really nice move.

But wait, I forgot.  In this news drivien market it's unlikely we will get a strong move up without good news from Euroland.  Perhaps the Summit will give us a catalyst.  Perhaps.  But even without anything from Euroland, there is a strong possibility that we will move up from here tomorrow.

Momentum - Up
Trend - Sideways with an up bias


Tuesday, December 6, 2011

No Silly, Not the Four Tops........

6:58 PM EST


Spinning Tops!  Today was a  <yawn>  boring day.  We had a little upside and ened up with a spinning top on the chart.  As you know a spinning top represents indesicion.  And after a strong advance it can often signal a change in character.  Is that the case today?  Depends on the news tomorrow!  LOL  But the weakness, especially after two red candles is duly noted.  Nothing much else to "muse" about.  Resistance noted on the DIA at 122.

Momentum - STALLED
Trend, UP but waning


Monday, December 5, 2011

Monday Monday, So Good to Me ~~ Mamas and the Papas, Circa 1966

8:57 PM EST

As we all know what goes up, must come down! Seems this morning we got some good news out of Europe. France and Germany said they agreed on something! Amazing! It was enough catalyst to get us up in the morning.  True to the way things have been in the recent past, we gapped up in the morning and went sideways, until we found out the S&P had Germany and a few other countries on the watchlist for possible downgrades!!  OMG!  What a surprise!!  LOL  But, in the end the DIA was up 78 points!

Advantage: Bulls!

On to the charts. The charts are showing a bit of weakness the last 2 days. If you look at the chart of the DIA below you will see that for the last two days (Friday and Monday) the market gapped up and ended lower, creating ugly red candles.

Additionally, looking at a smaller time frame (see the intraday five-day chart below) you'll notice it looks like we might be building a little bear flag. And we all know what that means. What??  Excuse me? You don't know what a bear flag is? A bear flag is a pendant that marches slowly upward giving the bulls confidence that they're making headway........ only to pull the rug out from under them at some point down the road precipitating a large drop in price.

Advantage: bears

Nonetheless prices maintained its stance in the channel and overall we have to give momentum to the bulls.  So for now it's.........

Momentum UP and losing a bit of steam,
All Trends UP


Thursday, December 1, 2011

Waitin' 4 the Jobs Data

6: 26 PM

Nothing exciting today.  But hey, after yesterday's upside barnstorming event a little calm was due.  So today we got nothing more than a little consolidation.  A spinning top (indicating indecision) at the top of yesterday's range (giving a bullish twist).  Quite appropriate.  So now we wait, and we wait as time ticks by.  We wait for the announcement on the jobs data tomorrow.  It could be the deciding factor of the day, if no Euroland news pops into view.  Payrolls, unemployment rate, hourly earnings and average workweek on tap tomorrow at 8:30 am.

Looking at the daily chart it's hard not to notice the numerous gaps over the last 4 months.  I don't ever remember a time where the volatility resulted in gaps up and down with such frequency and for such a long period of time.  If you remember such a time, send me a note and the time frame for my review.  I am sure that you, like myself long for the resolution of Euroland and other issues that have created such an intrepid market.

Below are the daily charts for the VIX and the DIA.  Current Momentum is UP~


Wednesday, November 30, 2011

Was Blind but Now I See - Amazing Grace, circa 1779

5:31 PM

It was one hell of a day!  DOW up 490 points or 4.24%, and closed over 12,000.  Volume was up big on the actual indices but not earth shattering on the DIA and SPY as one would expect from such a big day.  That leaves me feeling a bit queasy.  So we need a strong follow thru to confirm this move.

Back to the headline.  Yes, was blind but now I see.  Or hell, maybe I'm just hallucinating!  It's anyone's guess.  But here's my "musings".  Two up days that are unexplained technically, unexplained fundamentally, and unexplained by news.  For no reason that I can fathom the market rallied Monday and Tuesday.  And.....how did I say it......oh, yea..... on crappy volume.  Today suddenly the fog lifts and I can see clearly again!  This central banking deal was in the works.  It didn't appear out of thin air! This took some time and cadres of people to coordinate.  I feel like the deer in the headlights, wondering why I didn't the following possibility Monday and Tuesday.  The "smart money" knew what was happening.  The insiders knew.  People who know people knew.  Hence the low volume on the Monday-Tuesday rally.  Getting in early to reap the rewards of being "in the know".  Today when the news hits they go all in.  A huge gap up is created and profits zoom filling the coffers.  The media jumps on it and adds fuel to the fire.  More profits for those "in the know".  

One has to wonder why the announcement was made "pre-market".  Why not wait until after the market opens?  Hmmmmm.  Can you say gap up?  Another interesting aspect is that all this occurs on the last day of the month!  Hmmmmm.  Why not wait until December 1st?  Someone needing to report less than expected losses?  Someone needing to make the end of month grade?  I wonder who?  Hmmmmmmm.  The timing is just too convenient.

And this news of central banks working in concert is nothing but a thin veil over a big problem they cannot fix.  It's a temporary fix and nothing more.  It will supposedly give time for the politicians to do their job.  Something they have refused to do for years now.  Do you really think they will do it this time?  Do you think Euroland leaders will act?  Don't count on it.  It's took a meltdown here in the USA to get something done and since then Congress has accomplished nothing to speak of.  Let me say that again.  Congress has done nothing to prevent another meltdown here.  NOTHING!  If that doesn't scare you, it should.  Things that were put in place after the great depression to keep it from happening again were slowly repealed.  And nothing has been put in place to prevent another meltdown.  I won't even talk about the loss of the uptick rule.

At best, the central banks are are placing a band aid on the problem and enabling politicians to continue their poor behavior of "doing nothing".  I do not think Euroland will make any substantial moves to fix this problem until things start to collapse as they did in the USA.  After all, if we were so blind, how can we expect them to see?  Maybe we should sing Amazing Grace for them!  LOL

So here's the technical take with the caveat that it's a news driven market and technicals just aren't working well.  The DIA and the SPY are back in the channel.  And the candlestick is clearly a bullish candlestick.  Looking at the charts the momentum is UP.  Perhaps that's the new nomenclature.  Market Momentum, not Market Trend.  So today, while I ponder this change in wording, I'm not publishing the "Current Trends".  Rather I'll simply state that the Market Momentum is UP.  But watch closely.  I would suggest that anyone looking to unload a few losers use this rally to dump 'em on the first sign of weakness.

Market Momentum - UP

Here's the charts.


Tuesday, November 29, 2011

OUCH~! They Threw a Party and No One Came~

7:08 PM EST


READ ALL ABOUT IT!
Consumer Confidence soared to new levels hitting 56.0 for November from 39.8 in October!!!!

READ ALL ABOUT IT!
Everyone was relieved that Italy's bond aution showed that they still could raise money to keep the wheels greased (albiet it at a rate of nearly 8 percent).

Yes, even though experts were only looking for a jump to 42.5 the Consumer Confidence number for November was 56.0  Who are these "experts" anyhow?  I mean really, Black Friday was a success, and they were that wrong?  Hey, if my mechanic was that wrong I'd fire his ass!

And Itlay sold a bunch of bonds raising the capital they needed.  Everyone sighed with relief.

The DOW responded by ZOOMING up a WHOPPING 32.6 points!  OMG~  What a rally!!  And volume on the DIA was an incredible 5,325,918!!  Sounds good until you notice that 5,325,918 is only 53% of the average trading volume for the DIA.  The SPY didn't fair any better.  It hit 74% of trading volume but price didn't move as much.

Why the emphsis on volume?  It tells you if people are trading in droves or if not one is trading.  Think about it, at the end of the first week, people aren't standing in line to get iPhones anymore.  Eventually, lower demand means cutting prices to get people in the door.  Same in the market.  It's no different.  Volume dries up at the end of a run.  And when no one wants to buy, the prices are cut as everyone begins to sell.  Maybe in a year you'll hear someone muttering...... "Yea, this iPhone 4S does kinda suck".

This little rally of Monday and Tuesday is on crappy volume.  I heard one pundit say it meant the "retail" investors weren't getting in.  Retail hell, no one is getting in here boys and girls!!  Look at the chart below and consider the drop in volume.  No one wants to take a risk here.  Everyone with a brain is thinking........this is prolly the top of this little 2 day run, and we only made it to the 4th floor.  Damn.  None the less the elevator operator is screaming "BASEMENT!"

Until some politicians get off their egos and actually acomplish something Europe is bust and the good ole USA ain't far behind folks.  Bill Gross of PIMCO actually came out and said it on national TV.  The elephant in the room has been identified again and I bet the general public missed it.  (Bernake has been saying this for years).

Excuse me?  Huh?  Ohhhhhh, what did he say?  He said that monetary policy is at a dead end in the US.   So that leaves fiscal policy.  And ya think Congress is going to actually do something about fiscal policy?  REALLY?  The Super Committee of 12 couldn't get it together.  How can a group of 435?   He also thinks Euroland is already in a recession (Duh) and that we could follow if something doesn't get done.  (What are the odds of that?)  He did note that the US Treasuries are the "the cleanest dirty shirts" out there.  In other words we're in debt up to our ears and our balance sheet ain't pretty...... but we still have the lowest risk in the world.

Ok, so the charts are below.  Note price, volume and the candlesticks.  The DIA looks a bit better as it closed over it's 50 SMA.  But the cards trump that as the SPY and the DIA are still lagging below the 50 SMA.  Add the incredibly crappy volume and you have a ride to the basement.  Caveat: Some stunning news like Europe has solved all it's problems changes everything.  LOL

No change in the trends.

CURRENT MARKET TRENDS
Long Term (Weekly Chart) – DOWN
Medium Term (3 day chart) – DOWN
Short Term (Daily Chart) – DOWN


Monday, November 28, 2011

A Kiss is Not a Kiss - Casablanca, circa 1942 - Humphrey Bogart, Ingrid Bergman

 Yes, a kiss is not a kiss.....

And Today, the DIA tried to start a leap to the bottom of the channel, where it would ...... "kiss the channel good bye" before tanking again.  But alas, it leap into action with terrific speed gapping up large and moving quickly to the 50 SMA, where it promptly stopped and turned tail.  Well, at least for the moment.  There's always tomorrow~

Volume is pathetic (see daily chart).  Yes, better then the anemic half day Friday after Thanksgiving, but none the less anemic even for a Monday.  Not the surging volume one looks for at the beginning od a solid move upwards.  A look at the 3 day chart gives a better perspective of the pending attempt to reach the bottom of the channel.

To this technician it seems more like a well fed bull who enjoyed the Thanksgiving feast, and having taken a nice rest was in the mood to get out of his chair and run a bit.  But only a bit.  At best a run to the bottom of the channel.  At worst, this turn at the daily 50 SMA is his best effort and the downside run begins again.

It the news again.  OMG~  A fiscal pact to sace the day!  OMG~  Yes!! Yes!!  Goodie, goodie!  Of course this is the 50th good rumor we have heard in the last few months.  Amazingly there are plenty of rubes in town to clap and smile about more BS.

No changes in the trends.  Below are the dialy and 3 day charts.


CURRENT MARKET TRENDS
Long Term (Weekly Chart) – DOWN
Medium Term (3 day chart) – DOWN
Short Term (Daily Chart) – DOWN


Friday, November 25, 2011

"It's a Wonderful Life", Circa 1946

Posted from my iPhone.

Remember the movie with Jimmy Stewart and Lionel Barrymore? Lionel Barrymore playing Mr. Potter, the crafty old boy who owns the entire town. Keeping them under his thumb, charging outrageous rates for everything in sight. And Jimmy Stewart, the hero who ran a Savings and Loan, a credit union of sorts, to save the day?

Who will save the day in Europe?

It's loansharking at its best! A legal rip off of sorts. Price gouging that would be quickly curtailed by the authorities in other circumstances. Just like the spike in oil a few years ago, where traders played on the hysteria and drove prices through the roof, the same thing is happening in Europe. Although it is a bit different. When you're down and out and you can't get credit no one wants to loan you money. And people like "Mr. Potter" (AKA Lionel Barrymore) take advantage of that! As a result the bond yields are soaring in Europe, things are beginning to crack and if someone doesn't come and save the day, the effects will be worldwide.

I haven't looked at the charts in a few days. I've been out of town. But it seems fairly simple. The Dow is down big, and it looks like we could be headed for the $10,000 psychological level. I've talked before about the need to test this level again. Hold on your hats folks this is going to be a roller coaster ride

No changes in the trends, everything is DOWN. But somehow I think you knew that.

Enjoy the rest of your weekend.

Tuesday, November 22, 2011

All Hands on Deck~All Hands on Deck~

No time to write much or be witty today.  As suspected we are going down.  Have the American people yet realized that no politician in office gives a crap about them?  Have they realized that the politicians only care about themselves?  If a Super Committee of 12 cannot get anything done, how can we expect the entire Congress to agree on anything and get it done.

America, it's time for a clean sweep.  Anyone in office, and I mean anyone needs to be booted out.  PERIOD!

Everything is down in the trends.


CURRENT MARKET TRENDS
Long Term (Weekly Chart) – DOWN
Medium Term (3 day chart) – DOWN
Short Term (Daily Chart) – DOWN

Friday, November 18, 2011

ZZZ-Zzzz-ZZzzz-ZZZ-Zzzz-ZZzzz . .

6:24 PM

It's raining; it's pouring.
Today the market was snoring.
It bumped it's head on the back of the bed,
And it couldn't have been more boring~!

Remember that nursery rhyme?  Huh?  What?  Nooooooo.  Never!  Not me~  I wouldn't think of changing the words!!  No Way!!

It really was a boring day.  Nothing much moved.  Volume was weak, which in this case says, no one is willing to make a commitment over the weekend.  Be ye bull or bear, no one wanted to commit to a direction for Monday.  Just hold and wait.  And speaking of wait....... OMG~  Look at the charts!!!  Could it be?  Is it real?  Is it a reversal candlesick on the DIA?  The SPY?  Hot damn and full speed ahead!

Uh-oh.  Wait a minute.  Not so fast there buddy.  DANG!  Seems that candle is a weak candlestick and that doesn't quite fit the reversal standards.  Sheesh.  It's RED for goodness sakes.  That's a no-no.  And the QQQ's?  Damn!  Looks like grandma's undies hangin' on the drying line.  In a word........ kinda saggy.

The Bulls aren't completely dead........yet!  Ok, a few died on the QQQ's.  But we still have two outta three of the majors.  There are still a few cards left to be dealt.  Me?  I'm a holding my powder until I see the whites of thier eyes.  Monday should give us a signal, and tell us if we're gettin' somethin' nice for Christmas or just a lump of coal.   There was talk of something getting done this weekend on the Europe fiasco.  (Yea, shaw~!)  Hey, feels like we're in Vegas and it's crap shoot city.  And the odds stink in craps~

Two changes in the Trends.  SPY, DIA, QQQ, daily charts below.

CURRENT MARKET TRENDS
Long Term (Weekly Chart) – sideways
Medium Term (3 day chart) – Down
Short Term (Daily Chart) – Down


Thursday, November 17, 2011

Watch Out She's Gonna Blow - BP Oil Spill, Deepwater Horizon Rig, circa 2010

8:54 PM
What a day~!  Over night yields crept up in Europe and the EOD (End of Day) selling from yesterday carried over to this morning despite some good news.  Yes, initial jobless claims were down to 388,000.  Housing Starts and Building permits were up.  But that damned Europe just won't play nice!!  Limey Bastards!!

Technical analysis is almost worthless in this environment, as the whispers, rumors and news events are keeping everyone swaying this way and that.  Nervousness pervades the market.  Looking at a chart of the VIX and it seems stuck over 30 for the last 4 months!  Yes, a reading over 30 indicates a lot of fear in the market and a lot of volatility.  For what it is worth things are not looking good technically.  I would not be surpeised to see more downside to this little run.

The Scoop:
Daily DIA is still in the channel by a thread.  It broke below the channel, turned on the 100 SMA and closed at the bottom of the channel.  A slim possibility remains that we are still in the uptrend here.  VERY SLIM!~   More than likely the weakness will take us down further, perhaps to the 50 SMA before we have a turn around.  3 day and weekly charts still looking ok, but the weakness is showing there too.Watch the news, watch the news, watch the news.  Oh, did I mention to watch the news?  Daily chart below.

Daily SPY has broken down, no if's..... and's ...... or but's.  The daily SPY broke thru the botom of the channel (see S1 on the chart) and is moving down.  It came close to the 50 SMA before reversing and closed right at secondary support, S2.  Next stop the 50 SMA.  After that?  After that is down by 2's.  120, 118, 116, 114.  Daily chart below.

The QQQ's are in the same shape as the SPY.  So it's 2 out of 3 predicting a lower drop and more downside before things change.  I suspect the DIA will now follow suit.  Changes in the Trends noted below.

CURRENT MARKET TRENDS
Long Term (Weekly Chart) – Up
Medium Term (3 day chart) –  Sideways
Short Term (Daily Chart) – Down


Wednesday, November 16, 2011

Snikes! "The Kansas city Shuffle!" - Lucky Number Slevin - Bruce Willis, circa 2006

7:59 PM

What's the Kansas City Shuffle?  Really?  REALLY?  Ok, ok, guess you missed one of my favorite movies, Lucky Number Slevin.   According to Bruce Willis, the Kansas City Shuffle is when everybody looks right and you go left.  Simple huh?  But what a great diversion!  And that seems to be what the market is doing this week.  The Kansa City Shuffle~!  We're looking up and the market goes........ ker-plunk.  Now go rent the movie.  You'll love it.  Bruce Willis, Lucy Lu, Ben Kingsley, Morgan Freeman and Josh Harnett.  What's not to like?

Seems we just can't get a break here.  We needed a close above the minor resistance of DIA 122.00  Instead, we get the Kansas City Shuffle and BAM!  The market takes a wrong turn.  But no worries.  We're still in the channel.  And we need to stay in the channel.  Also it would be nice if the 3 day and the weekly chart managed to stay above the 50 SMA. Breaking below that gives a negative connotation to the current uptrend.

On the daily chart we are now below the 200 SMA and we did a slight turn around on the 20 SMA today.  Can you see that on the chart?  I doubt that support will hold, but again it all depends on the news!  It's really amazing.  Buffet has been on a buying spree this year, spending some 24 BILLION on stocks like IBM, BAC, WFC, V, DTV, DG, MTB, INTC, CVS!  You'd think that alone would lend confidence to the market.  <sigh>  

No changes in the trends.  Below are the daily, 3 day and weekly DIA charts.  Look at them, read them, learn to fish.  


CURRENT MARKET TRENDS
Long Term (Weekly Chart) – Up
Medium Term (3 day chart) – Up
Short Term (Daily Chart) – Up


Tuesday, November 15, 2011

High Ho, High Ho, Where will the Market go? ~ The Seven Dwarfs, circa 1937

8:52 PM

High Ho, High Ho, Where will the Market go?
Will it go up high,
Will it go down low,
High Ho,
High Ho, High Ho, High Ho~

Ahh, if only it was all as wonderful as Snow White and the Seven Dwarfs.  <Sigh>  Instead we have a week marked by poor volume and little movement.  Of course this compares with the willy nilly, wild moves of late.  So it's a nice diversion.  Europe is still there but it seems the market is getting used to the idea that Europe is a mess and will be so for a while.  Hence, instead of crazy big moves we just sit and waggle.

In the meantime, we can sit back and watch as the few and powerful try to squeeze Occupy Wall Street into submission.  Seems suddenly someone is a bit worried it might be the beginning of the peasants actually starting a revolution!  OMG~  So pressure has been brought to bear, a few phone calls to the right places and suddenly the police are trying to break up the party.  Of course they forget that the best way to actually incite the revolt is to try to stop the party.  <Sigh>  Pity the poor powerful fools.  Perhaps they should just say, "Let them eat cake"~  Hey, it worked for Marie Antoinette!  Didn't it?  Well, at least up until the part where they used that guillotine thingy and beheaded her!  NICE~!

The Charts
Not much to report on here.  But an interesting note, the DIA and the Q's are above the 200 SMA.  The SPY has not recovered and is stuck beneath the 200 SMA.  A divergence that lends to an air of uncertainty.  It would be nice if all three indices where above their respective 200 SMA.  That would give a stronger indication of an upside resolution to the week/month.  No changes in the trends.  Below are the daily charts of the SPY and the DIA.

CURRENT MARKET TRENDS
Long Term (Weekly Chart) – Up
Medium Term (3 day chart) – Up
Short Term (Daily Chart) – Up


Monday, November 14, 2011

Extra, Extra, Read All About It~!

BLOGGER SCREWS THE POOCH!!!

Yes, it's true and it has been verified by a reliable source.  The blooger in question..... (ME!) ...did not update his SPY chart before posting it here in last night's 8:46 PM post.  He will receive 50 lashes with a large wet noodle.  Below is the corrected SPY Daily Chart.  Note the decline in volume previously mentioned last night at 8:46 PM

OK, here's the CORRECT SPY chart for Monday 11-14-11

"Monday, Monday" - The Mamas and the Papas, circa 1966

8:46 PM


Yes, it was a Monday all right.  Google the lyrics and see if things don't make more sense.  And looking at the volume one wonders if everyone stayed home to make it a four day weekend!  We are chopping around, gapping up-down here and there, the likes of which I have never seen and with such persistency.  It's all about the news, the jitters, a nervous market and......wait for it..........yes........EUROPE~!

Today was a bit of a down day.  But no damage done to the technical picture.  We are still "Up, Up and Away" (The Fifth Dimension, circa 19676)

No changes in the trends.  Daily SPY chart below.  I showing the SPY to illustrate the decline in volume which does not really show in the DIA but does show on the SPY, the QQQ, and the actual DJ-30.  Of particular note is the fact that Monday's volume was more anemic than last Fridays.  And last Friday was Veterans Day!

CURRENT MARKET TRENDS
Long Term (Weekly Chart) – Up
Medium Term (3 day chart) – Up
Short Term (Daily Chart) – Up

Sunday, November 13, 2011

"We're Moving on Up" – George Jefferson, 1975

8:35 PM

Yes we're moving on up. We had a great day Friday with a nice bullish candle and we are on our way to the top of the channel.  Of course that's assuming that Europe gets its act together.  They are still in a very precarious position, and the politicians are still jostling for power, rather than taking care of the problems. They have learned their lessons well at the U.S. Congressional School of Idiocy.  What?  Of course they are all graduates of that fine institution!!

But heck, let's focus on the charts. We now have a nice candle after bouncing off the 20 EMA and we're moving again towards the top of the channel.  Volume was a bit anemic, but we expected that with the holiday and all.  DIA Target 124.50.

The amazing thing is that in spite of the problems overseas, the stock market continues to trudge and make its difficult journey upward as it climbs the wall of worry.  It doggedly refuses to be trounced, and despite the news continues to fight it's way upward little by little. If Europe would only get out of the way, the stock market would take off.  That much is obvious.  Of course Europe's problems are not going to be solved quickly. <Sigh>  But the sooner they are solved, or the sooner we get used to hearing about it, the sooner the bulls will come out to play.......in force.  Perhaps Santa will give everyone a nice present this year.  And we can all get our kids the "G.I. Joe with the Kung Fu Grip." (Eddie Murphy, Trading Places, 1983)

No changes in the trend table.  Daily, 3 Day and Weekly Charts of the DIA below.


CURRENT MARKET TRENDS
Long Term (Weekly Chart) – Up
Medium Term (3 day chart) – Up
Short Term (Daily Chart) – Up


Thursday, November 10, 2011

Do You Dress on the Right or the Left?

5:18 PM

Just a few minutes ago a friend of mine asked me if I thought the market was going to go up or down tomorrow.  He has a habit of asking others to make his decisions for him.  I simply said to him what a man with two penises says to his tailor when asked if he dresses on the right or the left..........."Yes"~

Let's face it folks, if I had the ability to forecast the market in advance I would be on a boat headed for the Tahitian Islands, never to return.

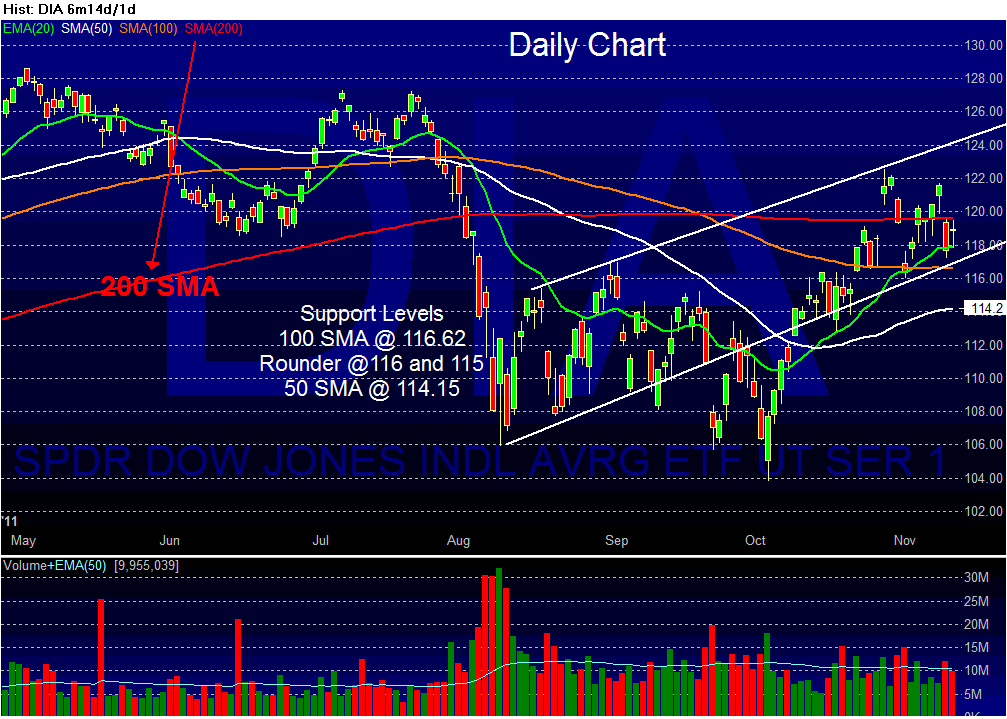
But I digress.  After hearing the news this morning about better claims numbers and the easing of Italy's bond yields, I was hoping for a turnaround candle on the chart.  Instead, price was turned back to the downside at the 200 SMA, not a bullish sign.   We are left with a neutral candle that leaves us hanging again, wondering what tomorrow will bring.  As usual for the last few months, it's all about the news!  We are still in the channel, although only by the skin of our teeth.    I'm hoping for an up day tomorrow, lest we break below the bottom of the channel.  That would not be a good thing and could take us on a downward run.   A close tomorrow above today's high would signal another run at the top of the channel.  

Keep in mind that tomorrow is Veteran's Day, and while the market is open, it is likely to be slower than a usual Friday.  Everyone will be taking off early for a three day weekend.

CURRENT MARKET TRENDS
Long Term (Weekly Chart) – Up
Medium Term (3 day chart) – Up
Short Term (Daily Chart) – Up (with just a wee bit of concern)


Wednesday, November 9, 2011

"Whoopsie Daisy~!" -Bill "the Butcher" Cutting, Gangs of New York, 2002

6:22 PM

Damn~!  Greece makes nice-nice and everyone gets spooked by Italy.  Go figger!  I just want to know what made 7% the "magic" number?  (For those not in the know that's the number Italy must now pay to borrow money)  Spooky!

Hey, remember that song?  By the Zombies?  It really does apply to the market these days.

You always keep me guessing and I never seem to know what you are thinking;
And if a fellow looks at you it's sure your little eye will be a winkin,
You pull me in thinkin' that you're going up,
and then you turn, and tank, and break my butt.

Love is kinda crazy with a spooky little girl like you.

OK, ok, so I changed a few of the words in the last two lines.  So sue me~  The market nose dived today.  There is no other way to say it.  And I feel compelled to say that the market always drops faster than it moves up.  And it drops with more volume than when it moves up.  Ever since the uptick rule was cast away by the all knowing SEC, precipitous drops on increased volume seem to be the norm.  What's the "uptick" rule??  This was a regulation that went into effect in 1938.  Like the Glass-Steagall Act was enacted to protect the markets, this was designed to stop the market from tanking rapidly.  Remember, after that initial "crash" that marked the beginning of the depression, the market continued to fall for some 10 days.  The uptick rule simply stated that the price of a stock must have an "uptick" (an increase in price) before you could sell short.  So falling stocks were somewhat protected, in that everyone could not simply "pile on".  It was cast away in 2007.  You see folks, FEAR is a much greater force than JOY.  Think about it and you'll surely agree.  So when a stock tanks, everyone runs for the exit.  Hence volume goes up and the price drops precipitously.  Yes, I do think that rule should be placed back into action.  Look at any chart and you can easily see that since 2007 down volume always seems to outpace up volume.

Like everyone else I think there is plenty to worry about.  Iran and the atomic bomb, Greece, Italy, Europe in general, and of course the US Economy.  Climbing this wall of worry will take a lot from the market.  And while corporate earnings are decent this quarter the future is tenuous at best.  Europe's problems will affect us in a bigger way than most people realize.  And yet today could turn out to be like many days in the past few months.  Just a fear raising it's ugly head only to be negated when logical rationale appears in a day or two.  Yet I feel there is a good possibility that we are headed lower (my lack of rationale?)

We are still in the channel and still wiggling our way upward.  Supports are listed in the chart below.  No changes in the trend table.  Yet wait for the turn around at support before adding to or initiating new positions.


CURRENT MARKET TRENDS
Long Term (Weekly Chart) – Up
Medium Term (3 day chart) – Up
Short Term (Daily Chart) – Up


Tuesday, November 8, 2011

Charlie Chaplin........

entered a Charlie Chaplin look-alike contest in Monte Carlo and came in third.  Now, that's a story!!  What does that have to do with today's commentary?  Nothing.  I just wanted to start this commentary with something other than self absorbed politicians or the latest rumor in Europe.  As I said again yesterday, Europe trumps everything these days.  A whisper, a rumor, a well placed word and the market jumps.  So while we look at the charts and the technical's, remember this is a news driven market, the likes of which I have not seen before.

We are still in the channel and based on the chart I would expect the price to continue to rise to the top of the channel on this run up.  Target DIA 125 or Dow 12,500.  Once that level is reached I'll be looking for a down move to the bottom of the channel.  Like those shampoo directions.....wash, rinse, repeat.  Alternatively reaching the top of the channel and getting some good European news (or some other hot news catalyst) could take price up thru the top of the channel to a new place in the sky.  If you didn't go long after the reversal at the bottom of the channel last week, you should have gone long on the mini-breakout today.  Again, look for blue skies above until we hit the top of the channel.  No change in the trend channel~

CURRENT MARKET TRENDS
Long Term (Weekly Chart) – Up
Medium Term (3 day chart) – Up
Short Term (Daily Chart) – Up


Monday, November 7, 2011

Chop Chop~

9:41 PM


Today I think I'll skip the editorial  comments........ you know, like mentioned the resignation of Greece's PM, or the issues at hand in Italy, or.....what?  Ok, Ok, Ok!

Right to the charts.  It was an up day after a lot of chop.  That is if you call intra-day swings of over 200 points chop.  None the less it was an up day .  And the DIA closed slightly higher than last Thursday.  We are solidly in the old channel and chopping our way to the upside.  Volume was pitiful today and last Friday, but hey.....come on.......it was a Friday and a Monday!  So regardless, price keeps ending on the upside even as the Bears keep trying to pull things down.

Fly's in the buttermilk what'll I do?
Market in the chop chop shoo fly shoo,
Rumors 'bout Greece and Italy too,
Chop to the Europe bail out.

Chop Chop Chop to the bail out,
Chop to the Europe bail out.

What's all that mean?  Simply put it means that even with Santa on his way, Europe trumps everything at the moment.  So wile the charts are solidly in the upside channel, and moving on to a Christmas Rally, one whisper from Europe can change everything in a New York second.  So stay on your toes boys and gurls.  Below are the DAily and the Weekly Charts of the DIA~  No change in the trend table.

CURRENT MARKET TRENDS
Long Term (Weekly Chart) – Up
Medium Term (3 day chart) – Up
Short Term (Daily Chart) – Up