Monday, October 31, 2011

Trick or Treat!

7:22 PM


Seems no one provided a treat for the market today so it had no choice but to give us a trick.  Dow down 276 points!  But all is not lost.  And perhaps the trick is not as bad as it seems.  Seems we got just a wee bit overextended and today was a big pullback day, when consolidation day was the expected flavor of the day.

The Daily chart had to fill the gap up and has almost done just that.  Yes, it happened in one day and we would have preferred 3-5 days with a nice consolidation pattern.  But just the same the gap fill had to be done.  Now the big question is, can price hold here.  It's above the second breakout (the first breakout being the top of the channel denoted by the first two white lines).  So we seem to have some good support.  And the next few days brings in new money to the Mutual Funds that has to be put to work.  Hoping for an upside resolution, but be ready for it to go either way tomorrow.  The VIX had dropped to the 25 level but today went right back up to the 30 level.  Volatility is back.  

Posted below are two charts.  A Daily Chart.  And a Weekly Chart.  Long term bias is still with the Bulls, in spite of the big drop today.

CURRENT MARKET TRENDS
Long Term (Weekly Chart) – Up
Medium Term (3 day chart) – Sideways with an upside bias
Short Term (Daily Chart) – Sideways


Thursday, October 27, 2011

Jumping Jehosaphat

9:17 PM

The Euro guys actually accomplished something!!  It's amazing  They must have missed the last few Congressional classes on "Doing Nothing 101".  And man did they set of the fireworks.  Congress......are you paying attention?  Congressional Super Committee.....are you watching?  Just think of the things Congress could accomplish if they actually DID SOMETHING!!

Anyhow, that was all the market wanted.  Somebody taking some damned action.  The Euro guys didn't do much and there is a lot left to do, but the market had been giving hints by it's reactions to previous rumors.  And today, when the news hit.........ZING, POW, ZOWIE, SHAZAM~!  Dow up 339 points!!

Really not much else to say.  Volume up nicely.  The DIA candlestick looks a bit weak, but the SPY (a wider market view) looks really nice.  The BULL has snorted and begun his charge!

Sing with me folks......

Here comes Santa Claus,
Making Wall Street's day,
The Rally's here and we hope it stays,
All the way to Christmas Day!!

CURRENT MARKET TRENDS
Long Term (Weekly Chart) – UP
Medium Term (3 day chart) – UP
Short Term (Daily Chart) – UP


Wednesday, October 26, 2011

Knick-knack paddywhack, Give a dog a bone!

5:41 PM

Yea, those Euro guys are good.  Today they threw the market a bone.  And that was all the market needed to stay on course.  At least the market was up for the day.  An apparent bare bones deal from the Euro guys seemed to be enough to soothe the saveage beast today.  No real details are expected until November but it was said that they were going to leverage the fund "fourfold" to some one trillion euros and press Greece's creditors to take losses of 50%.  But since there were no real details, let alone a concrete plan, Euro Headline risk will continue.  Isn't it amazing how doing nothing can look like something?  Reports (or did they mean rumors) of China coming to the rescue was another entry in the plus column.  Soon China will own everyone and they will be able to rule the world without firing a shot!

The Chart
Intra-day dipped down to the 100 SMA and reversed like clockwork.  Then the market stopped short of the upside resistance.  We do have a bullish candle, but until we break the resistance mark we are technically once again in a sideways consolidation.  With the BS continuing in Europe, be ready for the same volitility and headline jerking that we have had for the last few weeks.  The only saving grace (if you want to call it that) is that the upper and lower lines of the channel are only about $2.50 apart rather than the previous $10 apart!  An acceptable risk for the Bulls.  A break above the channel puts the Trends to UP and takes us to the 121-122 area.  Seems Santa is on his way~!

CURRENT MARKET TRENDS
Long Term (Weekly Chart) – Sideways with an upside bias
Medium Term (3 day chart) – Sideways with an upside bias
Short Term (Daily Chart) – Sideways with an upside bias

Tuesday, October 25, 2011

These Guys Are Good~!

10:01 PM


First my apologies for yesterday's Profit Margin.  Apparently it just went out tonight rather then last night!  It was an error on my part and has been corrected!  

OK, back to business..........

Yes, these guys are good.  So good I a amazed.  How could any group of leaders be so adept at following our Congressional Leaders?  The Euro guys have done it!!  That have effectively done absolutely NOTHING to resolve the Euro crisis.  Isn't that amazing?  Just like our Congress doing nothing to fix things here at home.  Amazing!!  Over and over again for some two years the Euro guys have accomplished little to nothing.  What a feat!  Yup, the Euro guys (just like our guys) are excelling at postponements, arguing, refusing to negotiate, and other stalling tactics.  I have not yet been able to understand this enlightened manner of crisis resolution, but I am sure our guys and the Euro guys know what they are doing.  I have hopes of someday learning this new method of managing money and crisis intervention so that I too can apply these principles to my personal life.  I'd also like to learn Uncle Ben's technique for printing money!  How cool is that??

Ok, enough sarcasm and BS.  But the Euro guys did do it again.  The postponed the Finance meeting scheduled for tomorrow, and later came out and said that the Summit meeting tomorrow that everyone was hoping would produce a "solution" plan, will probably not produce the results the markets are looking for.  Translation............ they ain't doing diddly.

And how did the market react to that?  DUH!  Tank Tank Tank (and I don't mean armored military vehicles).  Of course Amazon and Netflix didn't help at all.  But for me the real issue is the politicians refusal to deal with reality.  That leaves uncertainty in the market.  And the market hates uncertainty!!  And as each "rumor" about a fix in Europe is revealed to be nothing more than hot air, the moves up get slammed back down.  Just like today.  And down on higher volume, which tells me that there is a much greater willingness to sell than there is to buy.

Chart  is below and speaks for itself.  Note the changes in the trend table.

CURRENT MARKET TRENDS
Long Term (Weekly Chart) – Sideways
Medium Term (3 day chart) – Sideways
Short Term (Daily Chart) – Down

Monday, October 24, 2011

Whoops there goes another Rubber Tree Plant~

9:31 PM


Just what makes that little ol' ant,
Think he'll move that rubber tree plant,
Anyone knows ants, can't
Move a rubber tree plant!

But he's got high hopes...
he's got high hopes
He's got high apple pie in the sky hopes.
So any time you're getting low,
Instead of letting go,
Just remember that ant.

Whoops there goes another rubber tree,
Whoops there goes another rubber tree plant.

Yes folks, "Whoops there goes another rubber tree plant"!  Seems the Euro guys just can't get their britches on right and no one can really agree.  So once again, they failed to unveil a comprehensive plan to fix Europe.  No plan equals no action.  No action eventually means that something is gonna hit the fan.  But hey, there's always the next meeting on Wednesday!!

And who the hell cares anyhow.  Seems the stock market ......... has ...........has, yes, go ahead, you can say it............. HIGH hopes!  Yes they have.... HIGH hopes.  The DOW was up 104 points today.  One just has to wonder if drugs are involved with those "HIGH" hopes!  I mean come on folks, sooner or later someone has to make a deposit into the checking account or things start to go "bounce"!  Wait a minute.............hold onto your hats........Can it be, yes, yes, yes.........

Whoops there goes another rubber tree,
Whoops there goes another rubber tree plant!

And yet back in the good ole U.S. of A. the bellwether of bellwethers........, yes, we're talking that global industrial company that sometimes seems to predict the state of the global economy.........Caterpiller AKA CAT to you market aficionados........goes gangbusters and reports expectation busting earnings, giving a strong earnings forecast to boot!  Now this is a good sign.  A very good sign.  On top of that, China reported an increase in manufacturing activity.  Another check mark in the plus column.

But everyone knows that ants, can't...........
Whoops there goes another rubber tree,
Whoops there goes another rubber tree plant!

The Charts
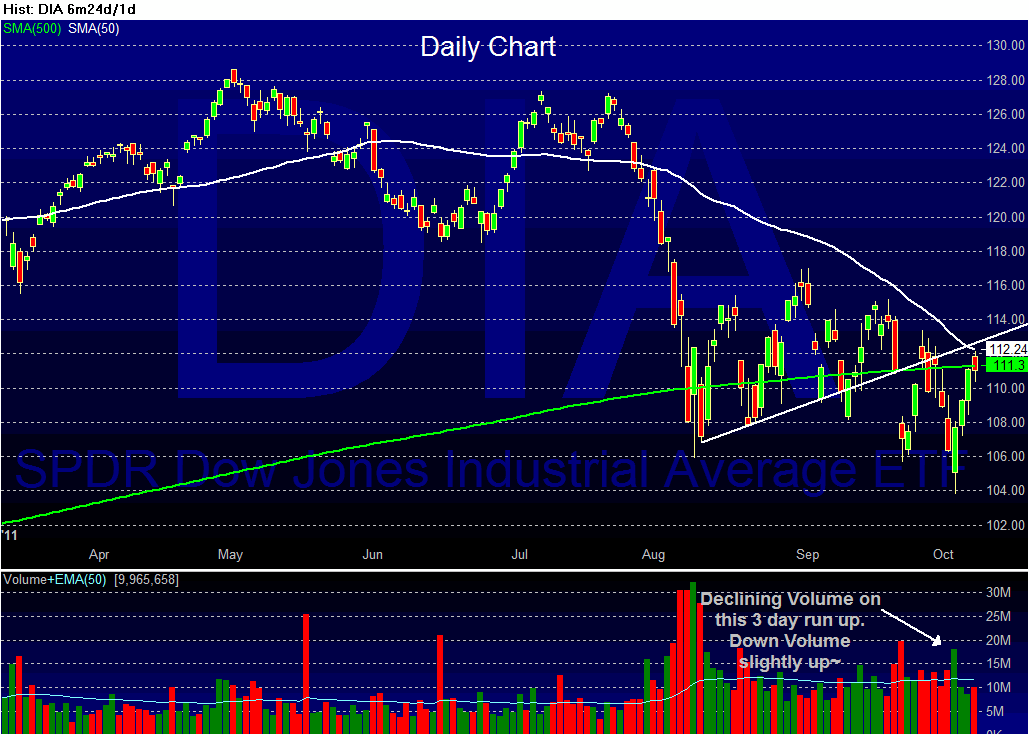
Up, up and away~  The Dow, DIA hit the 150 SMA and reversed slightly.  Just above that is the 200 SMA and then the 12,000 mark for the DOW.  The SPY has a bit more room to move to hit those same levels.  And the QQQ's are looking very strong in all three trends getting an "UP" rating for each.  So we have a possible stalling place for the DOW with the SPY not too far behind, and the QQQ's ready to run.  Volume was down a bit, but it was a Monday, so it is somewhat expected.

My take is that with the understanding that Europe could screw everything up on a global scale I am going to say it's time to hit the old BUY button.  Actually, you should have already done that earlier today when  the market opened on a higher high (see yesterday's report)

Oops there goes another rubber tree,
Oops there goes another rubber tree plant!

CURRENT MARKET TRENDS
Long Term (Weekly Chart) – UP
Medium Term (3 day chart) – Not quite an "up"
Short Term (Daily Chart) – UP

Friday, October 21, 2011

Golly Gee~ Hold Your Horses and Hang Onto Your Hat!

5:07 PM

Yes folks, we have a winner~!!  That's right.  After weeks of searching high and low we finally have a winner!  Today the DIA and the SPY closed over the top of the channel and said.......BREAKOUT!  The elevator operator has hit the "up" button.  The snorting bull of the last few days, consolidating at the top of the channel, pawing at the ground, has charged and easily broken thru the resistance and even closed over the 100 SMA.  The 20 SMA has officially crossed the 50 SMA.  We gapped up and closed on the high, creating a Marubozo candlestick.  This is a very bullish candle.  Everything seems to read...... Bullish, Bullish, Bullish, Bullish~!  Now all we need is a confirmation high and it's off to the races folks.  So check those charts, find the uptrends, the breakouts and pull the trigger Monday when it breaks today's high (Friday 10-21-11).

Seems the Euro rumors might just hold water (the Euro conference runs thru 10-26-11).  Maybe a real solution is baked in the pie.  As I said yesterday only a few know for sure and it looks like they were putting their money down today by the bucketful.  Good volume on the SPY, and great volume on the DIA.  Only the QQQ's have left us wanting.  And they have AAPL to hold them back.  So......... hope for that positive Euro solution, listen for the ringing sounds of Santa's bells, and keep meditating and chanting "Go Baby, Go"!!

The Charts~
The old top of the channel resistance and the 100 SMA are now support levels and another layer of safety on the downside.  Volume is good, the crossover is in place, next stop DOW 12,000~DIA 120.00~SPY 127.50

CURRENT MARKET TRENDS
Long Term (Weekly Chart) – Sideways
Medium Term (3 day chart) – Too Close to call - Sideways/Up
Short Term (Daily Chart) – UP!


Let Them Eat Cake ~ Marie Antoinette (Born 2 Nov 1755 - Beheaded 16 Oct 1793)

8:40 AM

Yesterday Germany and France could not agree on a thing.  Seems the rumor today is that they agree on the basic points and a plan could be in the works.  REALLY?  Gee, we've never heard that before!  Or have we...........?  In reality, only a select few know the truth.  Yet Europe is up this morning on the rumors as the PIIGS exclaim "Yea, we'll all be saved"!  In the meantime there are protests in Greece, the Middle East, and yes, even America with Occupy Wall Street appearing in cities across the USA.

And yet nothing really seems to transpire.  The leaders of the world seem impotent.  The politicians ignorant of the chaos.  No actual resolution happening in Europe, Mideast dictatorships watch in ignorance as surrounding dictatorships topple, unemployment is still at an all time high while US politicians keep screaming and shouting but offer no action-no solutions.  And the media thinks Occupy Wall Street is just a cute little gathering of people.  Really?  REALLY?

It all seems to scream "Let Them Eat Cake"!

Meanwhile the charts are just chugging along, consolidating at the top of the channel, with lower highs each day.  Above is the "top of the channel" resistance and the 100 day SMA (orange).  The market seems to be struggling, working, waiting for the moment it will beak out to the upside.  Will the catalyst be a European solution?  Even the 20 SMA (green line) is trying to move up thru the 50 SMA (white line).   Another bullish indicator trying to form.  Yet while the odds seems to favor an upside breakout, until a it occurs in this news driven market, anything is possible.  To avoid false breakouts (see candles 8/31 and 9/1) it's usually best to wait until the market has a close over the resistance line with good volume and a strong pace.  And the downside possibility still lingers.  So tread lightly and keep your powder dry.

Everything is sideways.

CURRENT MARKET TRENDS
Long Term (Weekly Chart) – Sideways (Trading Channel)
Medium Term (3 day chart) – Sideways (Trading Channel)
Short Term (Daily Chart) – Sideways at the top of the channel

Wednesday, October 19, 2011

Pogo Sticks, Simon and Garfunkel

8:39 PM

It hit me tonight that the market action lately is like being on a pogo stick.  Up and down, up and down, up and down, bouncing all over the place.  Looking at the daily charts you can see the trading channel since early August.  We're still waiting for a breakout or a breakdown.  In the meantime remember that Simon and Garfunkel song.....

"For everything, 
Churn, churn, churn, 
There is a season,
Churn, churn, churn.

The only good thing about the daily chart below is that the market seems to be trying to consolidate at the upper end of the trading range.  That bodes well for a potential breakout to the upside.  And while I would love to see that come to fruition, I just don't see it in the cards.  There are too many unaddressed problems from China's inflation to the Euro mess for me to feel good about the potential upside.  Time will tell.  Keep watching the charts, playing the tape and waiting in the bushes for that tiger to run one way or the other.  Then take aim and pull the trigger.  But until then, it might be wise to keep your powder dry.  Remember Money Management is key to winning this game.

CURRENT MARKET TRENDS
Long Term (Weekly Chart) – Sideways
Medium Term (3 day chart) – Sideways (Trading Channel)
Short Term (Daily Chart) – Down


Wild Kingdom~

8:25 AM

Yup, it's a wild kingdom in the world today~  And worse than that, the Apple has fallen from the proverbial "beats expectations" tree.  What's a trader to do?

Not much to say today.  It's really kinda repetitive.  Looking at the daily chart illustrates the wild ride of rumors and the manic-depressive reactions of large traders.  Mania - BUY.  Depression - SELL.  Yesterday was more of the same.  Looking at the 3 day or weekly chart one clearly see's a trading channel that can also be interpreted as a Bear Flag!!  So long term one needs to patiently wait for a breakdown below the channel, or a breakout above the channel.

Suggestions?

Don't fight the tape.
Be nimble with your trades.
Longer term, wait for the "signal" before committing to the market.
Pay close attention to the news, as the rumors clearly drive this market.
Watch earnings.  Any disappointment and the stock tanks.  Good news and the stock gives a little pop.
Go to cash and take a vacation for a couple of weeks~!

Chart below is a weekly chart.  Enjoy!!

CURRENT MARKET TRENDS
Long Term (Weekly Chart) – Sideways (Trading Channel)
Medium Term (3 day chart) – Sideways (Trading Channel)
Short Term (Daily Chart) –  Yes


Monday, October 17, 2011

And the Chickens Come Home to Roost~

9:14 PM

If you have been checking in you know that for the past few sessions I have been expecting a turn to the downside.  I even changed the trend table a time or two.  I felt like the proverbial deer in the headlights.  Clueless.  But alas I was early!  Today the sellers have come out of hiding to play while the buyers seem to have run away.  Of interest is that volume is up on the DIA, but not the SPY or the QQQ's.  None the less, the elevator operator has pushed the "Down" button.  So now it's just a matter of what floor we stop on.  

Guess the Bulls have heard that the rumors and hope about Europe finding a quick resolution to their financial woes were just.......well ...........RUMORS!!  Yes, seems it has been made clear (By some very official Germans) that the upcoming meeting of the Euro Leaders will not bring a defined plan or any concrete action.

No need to re-hash the rest of the days event.  I'll let the chart speak for itself.

CURRENT MARKET TRENDS
Long Term (Weekly Chart) – Sideways (Trading Channel)
Medium Term (3 day chart) – Sideways (Trading Channel)
Short Term (Daily Chart) – Down

Sunday, October 16, 2011

Hi Ho - Hi Ho - Where Did the Sellers Go??

8:14 PM

Seems the Bulls are in control and I'm just sitting here scratching my head!  Of course we have all been following the trend, and not fighting the tape.......right?

China's CPI is overheating, Michigan Sentiment is down again, Business inventories are higher, Retail sales are higher,  Europe is .......well who the heck knows!  JP Morgan beats....but stock takes a dive, Google beats and moves up nicely, Steve Jobs dies (moment of silence please) and Apple stock price goes up (What?), Europe is ..........well who the heck knows, Occupy Wall Street Protests go Global, the VIX is finally under 30 for the first time since early August, and some big players need to show a profit for the year and times a wastin'!!  Just sayin'.

Mix all that together and it spells..........it spells........it spells......I have no idea.  Overall things globally look pretty grim.  And yet hopes of a Santa Rally, A European TARP, and a Greek Miracle seem to have the Bulls excited!  Yea, makes sense to me.  But what's up with the anemic volume on this rise to the top of the channel?  Where's the strength?  So remember, as PT Barnum once said, there's a sucker born every minute.  Going long now is somewhat akin to buying at the top.  So make sure you're ready if things go south.  Not that they will, just sayin'.  Seems to this skeptic that the proof is in the pudding and it'll be day to day for me.  Yup, I ain't holdin' overnight til I get some confirmation one way or the other.

The charts show that we are at the very tip top of the trading range on the SPY and the DIA and the Russell 3000.  The Nasdaq Composite has already broken out.  Now, many a man would argue that tech and small caps always lead the way.  And there is some truth in that statement.  But so far only the Nasdaq has made it over the hump.  No one else has come along for the ride to confirm the move.  Just being cautious.  As I said the proof is in the pudding and this skeptic is still waiting for the actual breakout to occur.  It could happen in the next few days or not at all.

CURRENT MARKET TRENDS
Long Term (Weekly Chart) – Sideways (Trading Channel)
Medium Term (3 day chart) – Sideways (Trading Channel)
Short Term (Daily Chart) – Up  

Thursday, October 13, 2011

Knights of the Roundtable

8:24 PM


In a world of followers there are a few people that dare to lead.  While most want someone else to find the answer for them, there are those who dare to "think for themselves".  Those are the people who succeed where others fail.   And while I am quick to offer my opinion about the market here at "The Profit Column",  my true motive is that I might impart enough knowledge to those few people that "dare to think for themselves".

Long ago I was added to a select group of investors that "think for themselves".  We were"Knighted" and sent a bottle of champagne!  It was an honor and a privilege to be Knighted, and I still feel proud when I think of it.

Tonight, I learned form the spouse of a fellow Knight that he has passed away.  His name was "Sir Fluctuate".  In his honor I will be silent about the days events and the chart below.  I will encourage you to look and decide for yourself.  To "think for yourself".  This will constitute my "moment of silence" in remembrance of a fellow Knight.

George Valkenburg AKA Sir Big Game Hunter


Surprise, Surprise, Surprise. (Gomer Pyle, 1962-1969)

01:46 AM

We actually had another "up" day in the market.  Shazam!  And yet the charts keep looking weaker and weaker, and I am still looking for that reversal.  But as I said in a previous post, "Don't fight the tape".  Confusing isn't it?

So here's today's deal.  Europe now has announced that they have a plan of what has to happen.  OMG~  A plan of what has to happen, but no actual plan to make something happen.  Golly Gee, I'm not excited!  

In the meantime we are stuck in what is now a trading channel.  And today's candlestick, while not a classic Shooting Star, it is an Inverted Hammer (think of Thor's Hammer upside down).  It tells us that the buyer's pushed hard and forced the price up, but couldn't hold the line as the sellers came in and pounded them back down.  It is a reversal candle, although not as strong as a Shooting Star (the same basic shape, but the closing price is lower than the opening price giving a red body)

Add to the day's inverted candlestick the 30 minute intraday chart below and you will notice very strong selling that accelerated (increasing volume) into the close.  This action will normally continue over into the following day's opening action.

And lastly, we hit the top of the trading channel which is a logical place for a reversal.  

Taken together the charts below are telling us to be ready for a reversal to the downside tomorrow.  But since you are an astute trader you will watch the news closely in this news driven market, and you will always remember "DON'T FIGHT THE TAPE"!

CURRENT MARKET TRENDS
Long Term (Weekly Chart) – Sideways (Trading Channel)
Medium Term (3 day chart) – Sideways (Trading Channel)
Short Term (Daily Chart) – Down


Intraday 30 Minute Chart


Tuesday, October 11, 2011

Our Lady of Slovakia AND "I Went to an AA Meeting"

8:3746 PM

It was a day of waiting. “Much Ado About Nothing” as a great poet once said. The DOW was down a few points, the VOLUME was down. And at the end of the day we got a little news. But we'll have to wait to see what the market thinks about it all.

Our Lady of Slovakia”
Seems the politicians there were all schooled at American Congressional training facilities. To think that a monstrous (sarcasm please) country like Slovakia can hold up a deal for all of Europe's salvation is but one small problem with a unified currency and no political structure for that unified currency. Yes, the Slovak Parliament rejected the plan to expand the European version of TARP, called EFSF. The politicians there are playing the same game our Congressman play. It's a rather old game called “Flirting with Disaster”.

Sing this next 4 lines to the tune “Garden Party” by Ricky Nelson

I went to a AA meeting, to reminisce with my old friends
A chance to share old memories and praise our earnings again.
When I got to the video conference call, they all knew my name
No one recognized me, I didn't look the same~

Yes, seems no one was giving up drinking at this meeting. Nope, not when the meetings speaker told his story. Everyone hoisted a glass and said “Pfffffffftttt”. Yes, Alcoa, the icon that officially kicks off earning season is down after hours. (As are the rest of the attendants of the AA meeting! Someone please get these people some coffee!)

The Charts

Not much to say. A nothing day on nothing volume. Just watch your P's and Q's. The charts don't look happy but a EFSF work-around could change all that and spell RALLY!

CURRENT MARKET TRENDS
Long Term (Weekly Chart) – Sideways (Trading Channel)
Medium Term (3 day chart) – Sideways (Trading Channel)
Short Term (Daily Chart) – Down


Monday, October 10, 2011

Fly's in the Buttermilk, What'll I do?

8:57 PM

We've all heard it before. The trend is your friend. And that still holds true. But when the VIX is telling you volatility is off the charts, and when 3 digit changes in the DOW seem common place (10 of 11 days) the trend is often defined in minutes and hours rather than days.

Perhaps you find yourself in a situation similar to mine. I was an investor. Then I became a Swing Trader, A Momentum Trader and now, I often find myself to be a Day Trader. No, my trade's don't start out with day trading in mind. But they often end that way. Often, having a nice profit at the end of the day and knowing the DOW can swing 200, 300 points in any direction on a whim, I simply take my money off the table and go home! Nanny, Nanny, Boo-Boo! And I mention all this for a reason.

Reason you ask? What could possibly be the reason for all this gibberish? It's simply this......

Don't Fight The Tape!

Yes, this is the “right now, this minute” version of “The Trend is Your Friend”. The daily charts clearly spelled out that this should have been a down day. I do not apologize for Friday's conclusions. But the weekend clamored with very strong innuendo from two very powerful Euro Leaders. And once again, everyone got really excited! REALLY, REALLY EXCITED. Yes, +330 points of excitement!! Did you argue with the tape this morning? Did you fight the upside the pre-market tape was clearly indicating? Or did you recognize what the tape was telling you? It was a “pick anything” and go long kinda day. A day that was hard to miss with any long stock pick.

What? The Headline? Yes, there is a reason for the headline. But do I really need to spell it out for you? I do? OK, there is a fly in the buttermilk. Actually, a couple of fly's!! While the market was churning (the buttermilk of course) a couple of fly's were noticed. Yes, you know what they are! ONE~ VOLUME!! It's not a lot of volume. And what does that tell you? Simply that there weren’t buyers galore clamoring to jump on the bandwagon. Yes, I know it was a holiday of sorts. And yes, the bond market was closed. But Volume just wasn't there to confirm this upside move. SECOND~ We have played this game for weeks. Rumor, Innuendo, Empty Words of Politicians. Later, when it is realized that there is no substance behind the words, the nice elevator operator asks “Going Down”?

The Charts
I will admit that volume and holiday's be damned, today's price movement did some damage to the technical  downside reading. The DOW, SP-500 and the Naz all broke thru the 50 SMA. And the DOW broke thru the Bear Flag Resistance line (which is losing it's authority anyhow). I still think we need to test the bottom before we can have a really good rally. But Yom Kippur is over, Santa is right around the corner, and we could have a year end move to the upside. But I ain't here to give my personal feelings about things.  Rather I'm here to read the charts. So check out the trend tables, look at the chart below and set your sights accordingly.

CURRENT MARKET TRENDS
Long Term (Weekly Chart) – Sideways
Medium Term (3 day chart) – Sideways (Trading Channel)
Short Term (Daily Chart) – Up


Friday, October 7, 2011

Shiver Me Timbers~!

11:12 PM

I was out and about today and really didn't pay attention to the news or the market.  Seems I heard the Payroll report was better - YEA!   But they forgot to adjust for the 58,000 striking Verizon employees going back to work!!  BOO!  And the unemplyment rate stayed at 9.1 percent.  Ho-Hum~  I'm sleepy already.  What?  Huh?  I was snoring?

On to the charts.  OMG!  Shiver me Timbers~  Shades of Seabiscuit!  What was it that I mentioned yesterday?  Could it be, could it be?  Yes by golly gee it was!  The 500 SMA and the 50 SMA!  OMG~  And what happened today folks?  Did the DIA really hit the 50 SMA and turn tail?  Can you say "resistance level"?  OMG~  And we even closed just under the ....... the ........ go ahead ...... say it ......... 500 SMA.  Folks the elevator has left the penthouse and there is only one way to go - DOWN!!  The real question is are we going to the first floor or the basement??

One changes in the trend table today.  Have a great weekend~


CURRENT MARKET TRENDS
Long Term (Weekly Chart) - Down
Medium Term (3 day chart) - Down
Short Term (Daily Chart) – Down


Thursday, October 6, 2011

Another Strong Bullish Day?

9:35 PM

So the talking heads would have you believe.  And......Maybe.   But volume is declining, drying up on this 3 day "rally".  With declining volume comes fewer buyers and soon......no buyers, just sellers!  It just looks like the classic move up only to turn tail and run for cover later.  Just needs a news catalyst.  The high today just happened to be at the 500 SMA.  Above that is the 50 SMA @ Dow 11,250 and then the old Bear Flag Resistance line slightly above that.

So keep an eye out for the payroll report and rumors from Europe. And remember that Yom Kippur begins sunset October 7th. (See Oct 1st Column).

In the meantime no changes in the trend table, just as there have not been any real concrete changes in the situation in Europe. I know, we keep hearing that things are "getting there", but will the train ever arrive?

Below are the Daily and the 3 Day chart of the DIA. Please note on the 3 day chart I changed the Fibanocci Retracements to the 2010 Low and 2011 High rather than using the 2009 Low. Just for a change in perspective. Enjoy~

CURRENT MARKET TRENDS
Long Term (Weekly Chart) - Down
Medium Term (3 day chart) - Down
Short Term (Daily Chart) – Up


Wednesday, October 5, 2011

Blah, Blah, Blah


5:55 PM


Not much to say about today folks. Yes, last night after the close Moody's cut Italy's bond rating 3 notches. Ho-hum. And today ADP payrolls hinted at better numbers for Friday's official report. Depressed commodity prices (Oil, Materials) helped pave the way to higher prices for commodities and hence those stocks.

A follow thru from yesterdays closing rally gave strength to the market and the impetus to carry on today. We are still under the Resistance line and I'm still looking for more downside eventually. Keep an eye on tomorrow's reports and earnings results as the season officially begins October 11 with Alcoa reporting. Volume was below average today, indicating that buyers were not rushing in from all sides to get into this supposed "rally". The daily chart says we might get a bit more upside. So watch to see if we break above Dow 11,000 or the resistance line at Dow 11,200

Once change in the trend table.


CURRENT MARKET TRENDS
Long Term (Weekly Chart) - Down
Medium Term (3 day chart) - Down
Short Term (Daily Chart) – Up


Tuesday, October 4, 2011

WOW, EUROPE IS SAVED! What? Huh?

Oh, it was just some guys talking?  Damn~

9:51 PM

Once again a few comments is all it takes. After being down BIG the indices all rallied at the end of the day to finish in the green! Really? REALLY? Seems all it took once again was the kind words of a few European officials and BAM! Intra-day RALLY! No, it's not a real rally silly. Just a spurt of buying and short covering. We're still on the way DOWN! You see, we have played this game over and over and over during the past few weeks. The whispers, the rumors, the political speeches in regard to Europe. Each time we were headed down, someone of consequence whispered a few magic words and BAM! Intraday RALLY! We even had a 5 day rally from well placed words and rumors during the "Bear Flag" scenario. After a short while, reality would rear it's ugly head! Then the market, acting surprised, would return to it's downtrend.

Yes I know, it was better when you thought you had a blind date with a hot, gorgeous babe. But remember, your best friend did say she had a "good personality" and was "really nice". And we know what that means! Yup. FUGLY! Rumors, wishes and hopes versus reality.

It's the same with the US Congress. What a bunch of asswipes!! They fight about the debt ceiling as if waiting until the last minute won't make a difference. Then they are offended and disgruntled when S & P downgrades the USA. Hilarious! They we even warned! What arrogance. Then there was the last minute fighting over........ of all the asinine things........ giving aid to fellow Americans after a natural disaster!! WTF? Fighting over approval of aid to our fellow brethren? Are you freaking kidding me? And now the "Super Committee" is headed the same way. The same BS is going on in Europe. No one is getting anything of substance DONE! Fellas, there is a global crisis happening, and you (the people in charge) need to actually DO SOMETHING!~

So they play the game, hoping the whispers and rumors and speeches might change things. And they do change things for an hour, a day, or a week. But then reality sets in they are befuddled again. Huh, go figger! It always worked before when they did nothing!!

Ok, the charts. The VIX is still over 40 and volatility is crazy! And as more and more people play the game volatility will continue at record levels. The major Indices all tell the same story. We're going down. Volume increased today, but we still need that high volume down day. And I have to tell you, the hairs on the back of my neck have been standing on end lately. I have this uncomfortable feeling that we will not hold the Dow 10,000 level. It's just a feeling at the moment. But.........

No changes in the trend table. But there's a couple of pretty ugly charts to look at below.

CURRENT MARKET TRENDS
Long Term (Weekly Chart) - Down
Medium Term (3 day chart) - Down
Short Term (Daily Chart) – Down


Monday, October 3, 2011

The Feta Cheese is Crumbling.............

6:21 PM
Again!  Yup. Apparently Monday is Greek Salad Day.  Everything gets tossed in the air and surprise, suprise......Greece announces it can't keep it's end of the bargain......AGAIN!  Is anyone really surprised? We've known that Greece was in an impossible situation for quite some time. A Greece default is inevitable. It's a matter of how bad will it be, and what might be done to lessen the blow.

So the catalyst once again gives us the reason for what the charts already knew.  We ended the day DOW 10,655  (Ba-dum-ching!)  The first support level we have mentioned again and again. The bigger question is......will it hold? Keep your fingers crossed!! But remember, Yom Kippur is not yet here (see the previous post).  This week could very well bring about a fall to 10,000 and the capitulation we need for a rally to appear.  We need blood flowing in the streets.  Panic, Fear, downside VOLUME!  And a little warning to everyone~  If we close below 10,000 things could get REALLY ugly.

No change in the trend table, no need for another chart.

Saturday, October 1, 2011

Round & Round & Round She Goes

11:14 AM

Down & Down & Down she goes.  No real change here.  The market headed down today as predicted.  DJ 30 Industrials down 240 points.  Are we surprised?  NOPE!  Did we make money?  Ya should have!  Fair warning was given and the writing was on the wall. There was no big positive news.  Thursday everyone was happy that Germany voted for the bailout.  Friday, the talking heads said, “Oh....that was already priced in”!

The news Friday was primarily negative.  Like DUH~!  There's not much to be happy about in this global economy and the charts are sending the message to be ready for negative news.  Friday the Eurozone CPI reported a spike of 3%, so forget a rate cute in Europe.  And China's manufacturing PMI contracted for the 3rd month in a row.  Ouch~!   Yea, Chicago PMI was better as was consumer sentiment, but not by much, so everyone ignored the those reports.

Also, remember that the old adage "Sell Rosh Hashanah, Buy Yom Kippur" is in play here. (Rosh Hashanah began sunset Sept 28 and Yom Kippur begins sunset October 7)  While not a sure thing, it does have some strong correlation. So just know it's there and pay attention. It's just another arrow in your quiver~!

The all important charts continue to tell us we are on our way down to test Dow 10,600 again and will most likely breakdown to Dow 10,000 in the coming sessions. A successful test of the psyche 10,000 level could lead to a nice Santa Rally! Keep an eye on RTH the retail ETF and strong retailers.

Daily and 3 day charts of the DIA below.  
No change in the Trends.  
Does it feel like the movie "Groundhog Day" to you too?

CURRENT MARKET TRENDS
Long Term (Weekly Chart) - Down
Medium Term (3 day chart) - Down
Short Term (Daily Chart) – Down