Sunday, June 3, 2012


Round & Round & Round She Goes, Where She Lands........


8:16 PM EST


Nobody knows.  But, we can make a good guess or two!  In case you have not learned it, learn it now.  Never try to catch a falling knife!!  I made mention of this when the market broke to the downside and I hope everyone paid attention.  And now, we have broken the long term support illustrated by the 50 SMA on the weekly chart.  (That's the 50 WEEK SMA!)

Next stop DOW 12,000.  And I don't think we can hold there.  So be ready for a drop to DOW 11,750 or even lower.  Supports are as follows:

12,000 Psych level
11,750 the approx 100 week SMA
10,800-10,700 the approx 200 week SMA and also the approx retrace of 2011 bottom.

The VIX is over 25 and over all it's major daily moving averages.  It is suggesting that this fear now embracing the market is here to stay for a while, perhaps thru the summer ..... perhaps longer.

It's a time to cull the losers from the pack and prepare to get some great buys.  Good, solid companies are being taken down once again.  The opportunity will arise to buy them when the turn around is confirmed.  So start looking at the solid companies that you want to own long term.  Put them on your watch list and wait.  Wait like a big game hunter.  Hide in the bushes.  And when the time is right, pounce!  But for now, just do the prep work.  It will be some time before the turn around occurs.


CURRENT MARKET TRENDS
Short Term (Daily Chart) – Down
Medium Term (3 day chart) – Down
Long Term (Weekly Chart) – Down

The charts.


Sunday, May 20, 2012


Express Elevator to the Twelfth Floor Please~


6:18 PM EST

I gave you everything you needed last week.  I mentioned the Greece insnaity.  I stated clearly that the VIX is elevated.  I even said "Dropping below this (the 100 SMA) will change everything and open the market to much more downside..............if we cannot hold the 100 SMA on the daily chart it is likely we could go as low as DOW 12,000 before seeing a change in direction".

Well, here we are.  Almost there, DOW 12,000.  This is a big psyche number.  And we may break below that as well.  Cross your fingers, as a close below 12,000 is very bad ju-ju.  That alone could take us all the way back to DOW 10,000.

Again, I won't re-hash the news.  Last weekend we knew the Greece issue was front and center with all the drama and spill over it implies.  And when we broke the 100 SMA on the DIA, I think I heard someone yell, "LOOK OUT BELOW!"  Yes, there was some good news on the economic front of the good ole USA.  But the insanity happening in Greece is making everyone so nervous that it meant nothing.  The Market tried to bounce a couple of times, but it was a no-go.  The Bears are hitting home runs and the Bulls seem to have left the playing field.

The only thing left is to wait patiently for a reversal and BUY, BUY, BUY.  There are some great stocks out there that have fallen for no other reason than the fear that Greece is causing.  When the reversal happens, it will be a good time to pick up a few bargains.  So get busy, reiview your fav's and more.  Find those bargains, and wait for the reversal.

Supports are DIA Daily Chart 200 SMA @ 121.81, then 120.00, and 118.00 after that.  Remember not to let the talking heads get you in a duther if we pierce DOW 12,000 intra day.  It takes a CLOSE below that number to incite another leg lower.

CURRENT MARKET TRENDS
Short Term (Daily Chart) – Down
Medium Term (3 day chart) – Down
Long Term (Weekly Chart) – Sideways with down Bias (Has not Broken the 50 SMA)


Sunday, May 13, 2012


"You Just Keep Me Hanging On~  The Supremes - circa 1966

 
3:06 PM EST

This past week there has been no big sell off, no big bounce, no panic selling, no big rally.  The uncertainty seems to just ............ keep us hanging on~!  Click here for Music
 
There really is no need to re-hash all the news of the week.  There was some big news.  But the bad news did not cause a collapse, and the good news did not cause a rally.  And everything seemed so uncertain.  No one was sure if the next news bite would bring something to praise or tears.  The market likes certainty.  And there was little certainty to be found this week.  Greece, Europe. JP Morgan, unemployment, employment, blah, blah, blah, blah. 
 
Shades of Last Years "Slipping on the Greece"
 
I did want to note the news on Greece.  With all that has happened over the last few years, it seems the politicians of Greece still do not understand the dire circumstances of the country's economic situation.  Go figger!!  They are still fighting about accepting austerity measures, etc. etc.  I will be surprised if they manage to stay in the European Union.  If they do it will be a miracle.  And if they do not, it will be a disaster.  The country will go bankrupt and the people of Greece will suffer enormously.  The wave effects will have a global impact.
 
I only mention this to emphasize the intense degree of denial.  And to give a "heads up" to the situation in other countries including ours.  People, especially politicians it seems, are unable to grasp basic economic and budgeting concepts.  They seem unable to see the consequences of the decisions they make until things become cataclysmic.  And even then, as Greece's politicians and people  have illustrated, most simply "do not get it".  Where are the leaders who care about the whole rather than just themselves?  The one's that care about the country rather than just their re-election.  Just Sayin'  
 
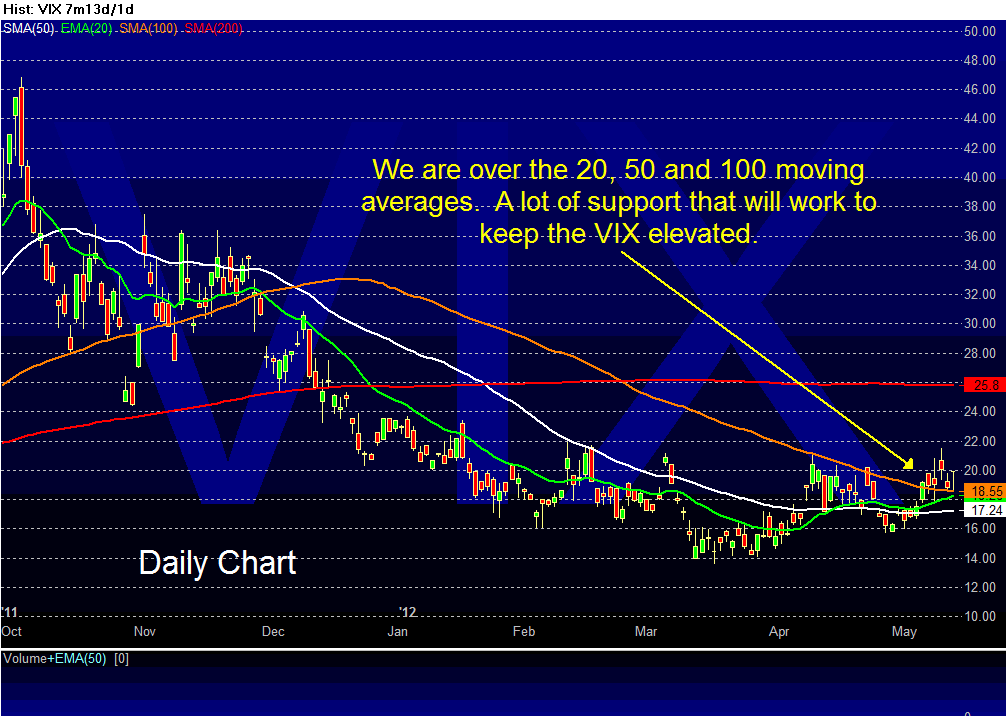
Back to the market, it's madness, and the logic of the charts.  The VIX has been pushing higher, and barely managed a close below 20.  Remember, under 20 = low volatility = good.  Over 20 = increasing volatility = bad.  Not only is the VIX barely under 20 but it appears to have made a bottom and is above it's 50, 20 and 100 SMA~!!  OUCH!  (Chart posted below)
 
The DIA.  Daily chart is holding on by the skin of it's teeth!  Closed Friday at 128.18 and the 100 SMA is at 128.16  Whew!!  Dropping below this will change everything and open the market to much more downside.  Minor supports below are 126 and 124 with good support at 122 and major support at 120.  Yes, if we cannot hold the 100 SMA on the daily chart it is likely we could go as low as DOW 12,000 before seeing a change in direction.  What?  Huh?  Yes, seems that old adage "Sell in May and Go Away" might have some validity this year.   I will be pleasantly surprised if the DIA can hold the 100 SMA next week.
 
The 3 day and weekly charts just confirm the story the Daily Chart is showing.  The 3 day chart is reiterating the Daily's major support levels of 122 and 120.  And the Weekly telling us the best support is the 120 level.    Below are the charts and the Trend table for your review.  Enjoy!
   
CURRENT MARKET TRENDS
Short Term (Daily Chart) – Down
Medium Term (3 day chart) – Sideways and looking for a bounce.
Long Term (Weekly Chart) – Sideways


Sunday, May 6, 2012


Jobs, Jobs, Jobs .....OR ....... Where did the Bulls Go, ooff, ooff, ooff  (Sing to the tune of "Who Let the Dogs Out")

8:08 PM EST

On last Sunday's commentary it was noted that the Bulls had returned and rallied price up and over the 50 SMA.  But it was also noted that things looked a bit weak, and that the burden of proof that this rally would continue was on the Bulls.  Yup, volume was noted to be on the decline as price moved up indicating fewer and fewer people willing to jump in at the rising prices.  Sadly, after a false breakout on Thursday May 3rd, the Bulls ran home leaving the Bears to lick their chops with glee!

Thursday the Bears began to take control.  But while it was a down day, some Bulls hoped for a turn around.  Then those dirty little reports about jobs came out on Friday.  And well, the Bears were chomping at the bit, just waiting for the opening bell .  When the bell went off,  "Fear Factor" began.  What?  No, different show.  This one's about being long and losing money!  The Bears went to work and chomped down on high prices all day.  One could almost hear the Bellamy Brothers (Trading Places, circa 1983) yelling "Sell! Sell! Sell!"

Not much else to say.  Monday will most likely be a continuation of Friday's dump.  And the 100 MA that coincides with the previous 2 lows should be a good support.  Better still could be the higher lows indicated by the arrows on the daily chart.  So the turn around could be about 129.50  Longs...... hold on to your hats, it could be a bumpy ride!

OK, a few charts below.  Bottom line is this.....  Support for the DIA area of 128 and Resistance at 132.50

CURRENT MARKET TRENDS
Short Term (Daily Chart) – Down
Medium Term (3 day chart) – Sideways Consolidation
Long Term (Weekly Chart) – Up


Sunday, April 29, 2012

Surprise, Surprise, Surprise! ~Gomer Pyle, circa 1962


6:41 PM EST


It was another surprise this week.  Monday we tanked.......again.  And The rest of the week the market recovered.  We once again find ourselves over the daily 50 SMA.  A good thing to be sure, but the burden of proof that this market is still in an uptrend, is clearly on the Bulls.

Yes, last week when the market first dropped below the 50 SMA, everyone was looking for a deeper cut to the downside.  But the market rebounded.  Yet when I look at the volume over the last weeks it is clearly declining as prices move up.  What does that tell you?  Huh?  Excuse me?  Of course you know what that means!  ARGHHH!  OK, here's the 4-1-1.  There are fewer and fewer buyers willing to wade in as the price moves up.  Simple.  And you know what that means!  What!?  AAAAAAARGH!!  Ok, it means when the buyers dry up, as they seem likely to do, price will begin to drop again.  The big question is "drop how far?"  The Bulls need to keep price above the 50 SMA to keep this train on the upside tracks.

Yes, interspersed with all the mediocre data are some salient points, and some really good corporate earnings reports.  Can you say Apple?  Amazon?  Bang, Pow, Zowie! (Batman TV Show)  Or as Jackie Gleason might say in The Honeymooners ......... "Pow, Right to the moon Amazon.  Right to the Moon!"  Ok, yes yes, of course he said Alice, not Amazon.  Duh!   The point is that in spite of the mediocre data there are some really strong corporate earnings reports.  Something many analysts thought would not be present this earnings quarter.  Fooled them!

And yes, the knee jerk reactions of the market participants seems to have returned.  Up, Down, Europe, Amazon, China, Apple, Google, Talking heads.  The VIX jumped around a bit.  The market can't seem to pick a direction and stick with it.  But it's not like it was last year with wild swings of 300-400 points every day.  So it pays to keep your eye on the ball.

To the charts.  Those wonderful, brutally honest charts.  "Just the facts ma'am.  Just the facts." 

CURRENT MARKET TRENDS
Short Term (Daily Chart) – Cautiously Up
Medium Term (3 day chart) – 
Sideways Consolidation


Long Term (Weekly Chart) – 
Sideways Consolidation with a Bullish Bias


On a side note Google has again changed everything, making my job more difficult.  As soon as I get accustomed to one set up, they change it all..... creating hours of extra work.  Please Google.  Revert to the last set up and leave it alone for we poor schmucks!!


The Charts!


Sunday, April 15, 2012

DIVE, DIVE, DIVE!

3:56 PM EST


Click here for Sound Effects  

We've taken a dive in the last week, but so far it's only a quick drop to periscope depth.  And yet, while traders scan the surface waters directional indicators, they "stand at the ready" to dive and plunge deeper if necessary to avoid those depth charge dropping destroyers.  So far we are still cruising just below the surface, but still .............

Easter weekend brought bad news.  Good Friday turned out not to be so good.  And even after pondering Friday's news everyone seemed ready to sell and run off Monday morning.  Trading triggers seemed to get hit in every direction.  And yet it was not a calamity by any means.  Volatility is up.  Volume is up, though nothing earth shattering.  The VIX jumped over it's 50 SMA and even broke the 20 level on Tuesday, but was turned back at the 100 SMA as if a door was slammed shut on it's rise.  The VIX is now stuck between the 50 SMA and the 100 SMA.

Surprisingly, the defensive, conservative DIA looks the worst of the three major indexes.  The SPY looks a bit better and the QQQ's even better!  Some would say it's due to AAPL.  Me, I just look at the charts, as they tell the story without regard to emotional influence.  The simple answer is that tech and the QQQ's have done much better over the last 8 months.  The August slump last year did not have the same profound impact on tech, hence it's chart looks better after this years run up.

Where are we headed?  Hard to tell with any degree of certainty.  The daily chart for the DIA is back to a consolidation mode under the 50 SMA.  And being under the 50 SMA is not a plus for the Bulls.  Price is even below last years high (see 3 day chart).  And on top of that this week's attempt to break back over the 50 SMA failed.  So the Bears have the cards for now.

Minor support is at 128, after which the 100 SMA comes into play at 125.76  (Yes, there is "rounder" support at 126).  So essentially it's a wait and see game next week.  China is going to let it's currency move a bit more, but I don't think that's a big market mover.  If the DIA closes below 128, there is a high probability that we will go down to the 126 level or the 100 SMA.  There's really not much in between to stop the fall.

The daily SPY look a bit better but is essentially in the same boat.  The QQQ's are still above the 50 SMA and hopefully can hold that support level of they break 66.

And don't forget Columbo, the world's greatest detective.  Huh?  What?  No way!  You don't remember what Columbo said?  OMG!  Ok, Ok, for the un-informed, the un-initiated, and those who have reached that certain age that is filled with forgetfulness.... here ya go.

Here's what Columbo always said when looking at a stock chart.  Oh, right....... crime scene.

"What's there now that wasn't there before?
  What was there before that isn't there now?
  And............. what's been moved?"

Remember that as you look at the charts below!!

Here's the charts and the trends.

CURRENT MARKET TRENDS
Short Term (Daily Chart) – Down
Medium Term (3 day chart) – Down
Long Term (Weekly Chart) – Up


Sunday, April 1, 2012

The Kansas City Shuffle - Bruce Willis in the film "Lucky Number Slevin", Circa 2006

12:27 PM EST


Just what is the Kansas City Shuffle?  Really?  REALLY??  Oh, you never saw the movie.  Wow, so sorry to hear that.  You missed a great movie!  The title?  No, it's not a typo.  The title is actually "Lucky Number Slevin".  It is one of the best movies of the decade and filled with stars old and new.  Bruce Willis, Josh Harnett, Sir Ben Kingsley, Morgan Freeman, Lucy Liu.  If you missed this movie, get it and watch it.  It is a great movie with some of the best dialog I have ever heard!!

Ok, ok, ok.  Back to business.  The Kansas City Shuffle is simply this.......
They look right, and you........look left!!  

Links:
Movie Trailer
Movie Clip defining the Kansas City Shuffle
The Song "Kansas City Shuffle"


This past week it seems everone was shuffling, Kansas City Style.  Up, down, pullback, month-end window dressing, consolidating, month-end dumping for profits, etc. etc.  And most got it WRONG!  You see my loyal followers, the pundits and media maniacs have become so damned myopic in their view of the market that they cannot see past the next 5 minutes!!  And who can blame them?  After last year's news filled drama and volatility it's no surprise.

But last year the VIX was up in the 30's and 40's!!  Outrageous volatility!  And as we know (we do know this.....yes?) when the VIX is under 20, and especially under 18, investor confidence is high and volatility is in a normal range.  The fear in the market is not rampant.  And it is fear that causes volatility.  The VIX this week has been at a low of 14.14 and a high of 17.27.

Additionally  we have learned that five minutes does not a market make.  Rather let's look at the daily chart and how it fits into the three day chart, and how the three day chart fits into the weekly chart.  One can even look at how the weekly chart fits into the monthly chart.  Look at the relationships between them.  Compare. Think.  Reason.

Let's take a step back and look at the forest, not just one tree.
 
This week I heard the talking heads say.......
It's a forest of disaster tress and the market will collapse soon!
No, it's a market of up trees and the market is moving parabolically upward.
Nah, it's a forest of bad European trees.
No way, it is a forest of "the rally is over" trees.

It's a market of .......oh hell, you get my drift.  Remember the three blind men describing an elephant?  None of them were right and yet all of them were just stating their point of view.

So what's the real deal?  Let's look at the charts!  DUH!!  Take a minute and review the charts below.  Think for yourself.  What do you see?  What conclusions do you draw?  What is price doing?  Volume?  Were do you think the market is heading?  Think.  Ponder.

Then, and only then, read my conclusion below the charts.  Remember, always think for yourself first!  That is the MOST important lesson of the markets.  Yes, I went just a wee bit crazy with the charts!  But only so you'll wait before scrolling down for my thoughts.


Did you take a minute to think for yourself?  Or are you cheating yourslef and letting someone else think for you?  Remember the old quote......Fish for a man and feed him for a day.  Teach hime to fish and feed him for a lifetime.


I gave you enough annotation on the charts that you should already know my thoughts.  But here's my take and the Trends anyhow.

I see the following on the charts.......

1- The VIX is under 18.
2. The uptrend line on the DIA daily chart has been tested and survived.
3. Price is still above the 20 EMA.
4. Price is still above the 50 SMA.
5. We've been bouncing sideways the last 13 days between 132.50 and 130
6. Volume is on a slight decline, but the buyers have remained in control.
7. The SPY looks stronger than the DIA
8. The QQQ's are running faster than the SPY (perhaps too fast?)
9. The Russell 3000 looks similar to the SPY.


Everything points to only one conclusion for me.  The rally is intact.  How long it will last is anyone's
guess.  And with this last weeks consolidation, it only makes sense to pay closer attention to the charts
in the coming weeks.  But let's not be Chicken Little.  Things are looking good.  And while some pundits
are predicting the upcoming earnings season will be weak, we'll have to wait and see.  Just like life.  For
now, everything is up.  So be attentive, watch your stops as usual, dump any losers, and add to winners
on pullbacks.

CURRENT MARKET TRENDS
Short Term (Daily Chart) – Consolidating with UP Bias
Medium Term (3 day chart) –  Consolidating with UP Bias 
Long Term (Weekly Chart) – Consolidating with UP Bias

Sunday, March 25, 2012

"Monday, Monday" - The Mamas and the Papas, circa 1966

8:08 PM EST

Monday, Monday.......it's up to you~
Will you break support?
or give us our due?
Oh Monday Monday~

That's were we are folks.  Monday, Monday.  We have had another pullback and we await the answer to the always tense question............will we bounce?  I think we will.  But that and a buck gets me a cup a java.  So I'll just wait for the market to make it's move and play the game on the next candlestick.

So make sure your pre-flight checklist is in order.

Plan intact?  Check
Charts reviewed? Check
Stops in place? Check
Clubs in the trunk?  Check
New glove and tees in the bag?  Check
Alarm set for 7:30 am tee time?  Check

Yuppers.  Go play golf.  Enjoy the day and let the market do it's thing.  We need some resolution and we won't know the answer to the question until the market closes Monday.  It will set the stage for our next move in this game of chess.  And in the meantime you can work on that nasty hook that has developed in your fairway woods!

Charts below with notes of interest.

Congrats to Tiger.  Your back!


Sunday, March 18, 2012

Nuttin' Honey - Kellogg's Circa 1980's

9:12 PM EST

Actually it was Nut and Honey.  But for many, and for this blog it's Nuttin' Honey!!  Yup, that's right.  Their ain't nuttin' worth talking about today.....honey!  The rally is intact and moving according to plan.  Ok, not really a plan, but moving nicely.  Friday was a down day, which prolly wasn't a surprise considering it was options expiration day.

So the DIA continues it's march.  Move, Rest, Move.  An army marching forward needs to move, rest, move.......and repeat.  As the market moves, it needs to rest, or pullback and go at it again.  Looks like we could have another pullback here if we break 132.  If we do it's time to add to good positions and initiate potential new ones.

Here's the chart and the Trends.

CURRENT MARKET TRENDS
Short Term (Daily Chart) – Up
Medium Term (3 day chart) – Up
Long Term (Weekly Chart) – Up

Tuesday, March 13, 2012

Surprise, Surprise, Surprise~ Gomer Pyle, circa late 1960's

11:58 PM EST

Shazam~  It happened.  The DOW broke decisively thru the 13,000 mark and took off!  Hate to say it but ........ told ya!!  Ok, ok, ok.  You got me.  I enjoyed saying it.  At the very beginning of the year I told you we had entered a Bull Market.  I've said it over and over and over.  I mentioned the bullish Golden Cross.  I reminded all of the slogan, "So goes January, so goes the year."  I've brushed off all the nay sayers and doomsday-ers.  I've stuck to my guns and in the last few weeks I have said that if the DOW breaks decisively over 13,000 it would take off.  And BAM!  DOW up 200 plus points!  Nice!!

I hope you have been paying attention.  I hope you have been long and have enjoyed this run to date.  I hope you took advantage of the recent pullback to add to good positions and initiate new ones.  This rally is not done.  Remember what I said about January.  So goes January ......... So goes the Year.

No need for charts.  No need for trend tables.  Just hold those longs and as always, keep those stops in place.  And smile as the profits grow~  Ride the wave baby!!

What?  Really?  Ok, one chart and that's it!

Sunday, March 11, 2012

Music for $1,000.....The Answer Is: Doo Wop and The Silhouettes 1957

11:47 EST


Buzzzzzzzz:  What is Dip, Dip, Dip, Dip, Dip, Dip, Dip, Dip.

Yes, it was just what the Doctor ordered.  We had a nice dip, a pullback, and it reversed at the uptrend line creating a "buy the dip" opportunity for those paying attention.  Were you paying attention?  Did you review a ton of charts looking for those stocks setting up for a buy?  Did you add to existing long positions that were setting up for more upside?  Hope so!  Wed was the get in early day.  Thursday was the safe bet day.  And Friday was the late entry momentum day.  Will Monday bring more upside?

Let's Look at the DIA, SPY, QQQ, VIX

Friday's Intra-day charts:  These charts (DIA, SPY, QQQ) are giving us signals filled with indecision.  There was no rally into the end of the day, nor was there strong selling into the close.  So nothing giving a strong carry over to Monday for the upside or downside.

Daily Charts - The DIA's Friday candle is giving us a signal of indecision.  It could even be signaling that things are again looking a bit "toppy".  The SPY isn't much better, having hit the uside resistance once again.  A push thru 138 is needed for the SPY.

3 Day and Weekly - These charts are looking stronger for the SPY and the QQQ.  Both are clearly looking for a break to the upside, the weekly looking like a dragster spinning it's wheels, getting the tires hot and sticky, just waiting for the light to go green.  The DIA is not acting quite as well.  It's working harder to stay at the upside resistance, giving a stronger indication that it needs more sideways consolidation before breaking thru the next upside barrier.  I get the impression that perhaps the market is getting comfortable with the improving global situation and is moving toward increased risk, shifting it's attention from the die hard blue chips of the DOW to the SPY, the QQQ and even the RUSSELL 2000 and 3000 ............ both of which we up strongly the last couple of days.

The VIX.  All the hoopla about the pop over 20.  Hmmmmmm.  A little quick on the draw by the pundits proclaiming doom and gloom.  With the Greek deal done and Employment looking better, the VIX is squarely under 20 and sitting calmly at 17, give or take.  Sanity reigns once again.

Charts, Charts and More Charts!!


Tuesday, March 6, 2012

Just what the Dr. Ordered???????

9:52 PM EST

Take one pullback in the morning, add a little drama from China, then Europe and see me on Wednesday.

We have broken down thru the 20 EMA and are headed to the 50 SMA. While many would consider this a negative downturn, I'm still thinking healthy pullback.

Yes, I know it was a big day, and the largest single day drop for the year, but I have been saying that we needed a pullback.  For Day Trading or Swing Trading for just a 2-4 day period, the tend is down.  Take advantage.  But for those looking for the longer trade, this breakdown is somewhat expected and just another warning to PAY ATTENTION!  Watch your stops, your profit margins and close long positions when warrented.  If price should CLOSE below the 50 SMA I will become bearish.  But until then, the long term rally is still alive and kicking.

CURRENT MARKET TRENDS
Short Term (Daily Chart) – Down
Medium Term (3 day chart) – Down
Long Term (Weekly Chart) – UP


Sunday, March 4, 2012

"Chicken-a-tor II: Judgment Day"

10:41 EST Sunday, March 4, 2012

In "Chicken-a-tor" we all remember his parting vow........."I'll be back" said Chicken Little,  "Asta La Vista Baby".  And sure enough, he has returned, leading the pundits, supposed experts and talking heads while reiterating his battle cry, "The Sky is falling, the Sky is Falling"!

Is this the beginning of the end?  OMG~
Is this finally the beginning of a correction?  Ohhhhhh, Nooooooo!
Pullback! Downturn Ahead!  We're tanking!
Blah, blah, blah, blah , blah, and more such gibberish.

Why is it that the media cronies and pundits are always trying so damned hard to sensationalize everything?
Ratings baby, we need MORE RATINGS!  Walter Cronkite, where are you?  And even more to the point, why to so many people even listen?  Does anyone think for themselves anymore?  Now there's a thought!!  Thinking for yourself.  OMG~!  Shades of Don Worden, a mentor of many and great teacher who "Knighted" his followers who thought for themselves.  BAM!  POWIE! SHAZAM!  We have a WINNER! 

I mean really, a few days of sideways consolidation, not even dropping enough to touch the 20 EMA let alone move back to the 50 SMA and the pundits and naysayers are all over the place predicting doom and gloom.  Here's a heads up people.  No Rally ever went straight up continuously!!  OMG George?  REALLY?  Yes, really.  A rally requires consolidations and pullbacks to continue it's upward momentum without becoming overbought.  (Someone should tell Apple that!!  LOL  It's recent parabolic rise is begging for a pullback.)

Also note that the VIX is under 20 and behaving well.  (Chart below)  The fear factor is subdued to normal risk levels.  And the market is not having the wild 300 point swings we had last year.  DUH!

I has also been pointed out by more than a few pundits that the Russell 2000 is in a negative divergence to the DIA and the SPY.  All I can say to that is ............ DUH!!  Coming out of the cellar, who wants to buy smaller, riskier stocks?  Not me!  I'll take the tried and true.  Have you looked thru a list of the Russell 2000 components?  If not, perhaps you should.  These are far from anything "blue chip".  I'd like to see things solidify more before I start buying stuff from the Russell 2000 index.

Sure, anything can happen.  Sure, this could be the beginning of a downturn.  And we plan for those possibilities.  Can you say "Sell Stop"?  The earth could vaporize at any moment.  Could happen.  An asteroid could collide with the earth.  Could happen.  The Mayan Calendar could be right and 2012 could be the end!  Ohhhhh, no!  Could happen.  And this blog COULD self destruct after you read it.  Could too happen~!!

Knock, knock, knock.  "Hello McFly, anybody in there"?  Knock, knock, knock.  

Remember, we are technicians!  We look at charts.  We check the underlying fundamentals.  We are the actuaries of the marketplace.  We look at the past and try to predict the future.  We knew Dow 13,000 would take some work to get thru.  We've talked about just that.  Lo and behold, that's what's happening!!  OMG~  The shock, the surprise, the dismay!  Amazingly enough the charts are saying nothing but constructive things.  So please, let's take Chicken Little,  place a muzzle on his mouth, and put him back in his cage.  Let him stay there until we get to "Chicken-a-tor III: The Rise of the Machines"

CURRENT MARKET TRENDS
Short Term (Daily Chart) – Sideways Consolidation (Upward Bias intact)
Medium Term (3 day chart) – Sideways Consolidation (Upward Bias intact)
Long Term (Weekly Chart) – UP


Sunday, February 26, 2012

The Tortoise!!

1:41 PM Sunday, February, 26, 2021

Remember the story of the Tortoise and the Hare?  Sure ya do.  If not, get those lazy fingers to work and "google" it.  It's a classic.  And lately we have had the pleasure of seeing the Tortoise in action.


The Tortoise is here, in contrast to that zippy, crazy Hare that we had to endure last year.  We had another nice, easy, boring week in the market.  A good, solid, upward, boring week.  The Bull keeps snorting and moving forward, pushing prices upward little by little in a sane and safe fashion.  (If you can call being pushed by a snorting Bull safe).  In contrast to the wild swings we were subjected to last year this slow advance forward should be a relief to everyone.  Could this year be the Year of the Bunny?  The Year of the Energizer Bunny?  Yaaa-hooooooo!!

The Charts (illustrated below)

The DIA is looking good, moving up nicely without moving too fast.  But as I mentioned before, the 130 level (13,000 DOW) will be a challenge and will most likely require several attempts before breaking out to the upside.  Of course there is always the possibility that it will not be able to pierce 130 and will instead retreat to the downside.  But for not the trend favors an upside breakout.

The SPY is similar shape, although it has has not made it's breakout move as the DIA has.  So there is some work left to do here even though the trend is still up.  It could take a few attempts to break thru this important resistance level.  Assuming some consolidation here, look for a nice "pop and run" when it breaks out.

The QQQ's are moving rapidly upward, in part thanks to the parabolic move by Apple, which comprises a large chunk of this ETF.  It NEEDS to rest, consolidate and even pull back a bit.  It's over-heated and over-bought.

The last comment is about your holdings.  Are the moving up?  If not, are they paying you a good dividend?  Are they worthy stocks to hold?  Sometimes you need to cull the wheat from the chaff.  Make sure you are looking at your portfolio on a regular basis, re-evaluating your holdings to make sure that are meeting your needs.


CURRENT MARKET TRENDS
Short Term (Daily Chart) – UP
Medium Term (3 day chart) – UP
Long Term (Weekly Chart) – UP


Sunday, February 19, 2012

Manic Depression - Jimi Hendrix, circa 1967

9:47 PM Sunday, February 19, 2012

Monday
   The Dow is up 72 points.
   Media and Pundits - Rally!!
Tuesday
   The Dow is up 4 points.
   Media and Pundits - Uh-oh, things are shakey!
Wednesday
  The Dow is down 97 points.
   Media and Pundits - We're in the crapper!
Thursday
   The Dow is up 123 point.
   Media and Pundits -  Yea, things are good.  Rally!
Friday
   The Dow is up 45 points.
   Media and Pundits - Rally!!

Pundits.  Who in the heck coined that word anyhow?  <Sigh>  Yes, the media, the pundits, the so called "experts" all have an opinion on every hourly move in the market.  And yet Warren Buffet, who rarely looks at the daily moves of the Dow, is acknowledged by these same people as the greatest investor of all time.  Huh?  Go figger!

So here's the skinney from this media pundit who wishes he was an expert.  Now that the VIX is under the 50 SMA and better yet, under 20, sanity has returned to the market.  So the wild daily moves spurred by nervous nellies everywhere have disappeared into rational moves.  The "news" isn't driving daily 300 point swings.  Thank goodness.

The DIA, while looking a bit over-bought to many, shows a break out Friday!  AGAIN!  Yes, we are moving to a new level.  I have repeatedly mentioned that we have been "bumping" up against resistance.  Trying to break thru to the next level.  A glance at the chart below shows the breakout.  Price is clearly above the top resitance line.  Those resistance levels wi;; now become support and we are moving to the 130 mark (13,000 on the DOW)!  Yeeeeee-Haw!

Do we need a pull back.  Yes.  And it will happen sooner or later.  But so what!?  Remember that slogan we've been bantering about?  The trend is your ............what?  Excuse me?  I can't hear you!  Yes, the trend is your FRIEND!  And until it ends this trend is clearly up.  So keep those stops in place.  Precious metals are a hold (you might even consider reducing your positions).  Stocks are the place to be at the moment.  DUH!

Below are the charts.  The Daily and the Monthly.  Please note that we're not that far from the all time high of the DIA, and hence the Dow.  I suspect it will take several attempts to pierce the 130 level and move above that.  THe Bulls they are a snorting!!

CURRENT MARKET TRENDS
Short Term (Daily Chart) – UP
Medium Term (3 day chart) – UP
Long Term (Weekly Chart) – UP


Wednesday, February 15, 2012

When the Bulls Go Marching In (Sing it Boys!)

1:27 AM EST


Oh when the Bulls, go marching In,
Oh when the Bulls go marching In,
Lord how I want to be in that number,
When the Bulls keep marching in.

The pundits shout,
The Media screams,
They say this rally is going to fail,
But those Bulls they keep on marching,
Oh when the Bulls go marching in.

I keep saying it over and over.  The Bull is here!!  He started his march the beginning of January and he is snorting and moving forward step by step.  Yes, the media screams this, the pundits scream that, but the Bull aren't listening.  Moody's downgrades a few more countries and adds a negative outlook for Britain, France and Austria.  Yawn, the bulls already knew that was coming.  Greece is doing an "orderly" default.  Ho-hum, priced in!!  No, this rally is not as maniacal as the running of the Bulls in Pamplona, but none the less, these are Bulls moving forward and refusing to stop.  They seem to be determined to keep on marching forward regardless of the headlines.  It's as if I can hear the lead Bull screaming "Steady as she goes boys!"

Why is it that no one wants to talk about the fact that things ARE better.  Things ARE improving.  And the "issues", especially those with Greece, are already baked in the pie.  (Gee, have I said that before?)  It is evident that Europe will have to go thru the same process we did to solve their financial crisis.  They are doing that, with Germany leading the way.  Contrary to some people's opinions, China is not dead, and things are growing over there (yes, they will have a little inflation, but so what!!)  Of course the media pundits can't say any of this publicly, as it makes Obama look good, and we can't improve his election opportunities!!  "Oh, no, things are getting better!" cried the Elephant,  that damned Donkey is going to win again!

U.S. Economy - Improving
European Crisis - Resolving
China's Growth - Alive and kicking

Sometimes even the Carney man has to scream........ "Folks, we HAVE a WINNER!"  Yes, we have a winner and the trend is UP!  And as we all know, the trend is your friend.  FOLLOW IT!

The Charts

First, I'll talk very briefly about the VIX.  A lot of pundits, including Chicken Little, and a nameless man whose initials are Peter Worden..... talked about the "spike" in the VIX last Friday and the horrid drop in the Dow.  OH NO!  THE SPIKE IN THE VIX!  OH NO!! THE DOW DOWN 89 POINTS!!  THE SKY IS FALLING!  And I pointed out the insanity of those remarks.  Those media boys and market pundits really know how to wring every drop of excitement from a dry sponge.  The VIX dropped back under 20 Monday and is still under 20.  The DOW has regained that HUGE loss from Friday without much effort.  Yes, the VIX is stuck on the 20 EMA and might likely bounce between that and the 50 SMA for a bit.  But so the heck what!?!?  Friday's spike was not a calamity.  The rally was not trashed by the little one day bump in the VIX.  No, the VIX excitement was a boring as the enormous 89 point drop in the DOW.  (Yawn)

The DIA.  Still in an uptrend.  Still bumping up against the upper resistance line.  Pushing, bumping, waiting for a breakout and another move up.  The Bulls hooves are pawing the ground as they trudge forward.  The Bulls are snorting as they await the starter's gun for the next move up.  Until proven otherwise the trend is up and as we all know .........say it with me ......... The Trend is your Friend!  On an intraday basis Monday was a gap up opening, a drop and recovery the rest of the day.  Tuesday we wandered downward until the end when the buyers came in and bought things up.  Gee, it's almost as if they were buying on dips!  Where have we heard that before?

So follow this trend.  Buy good stocks on dips.  And keep those stops in place!  Trends don't last forever and if you are greedy like me, you like to KEEP your profits.  Here's the "surprising" trends.

CURRENT MARKET TRENDS
Short Term (Daily Chart) – UP
Medium Term (3 day chart) – UP
Long Term (Weekly Chart) – UP


Saturday, February 11, 2012

The Sky is Falling!! The Sky is Falling!! - Chicken Little, Circa.....Ummmm......Eons Ago

Oh, NO!  The Sky is Falling!! The Sky is Falling!!  Quick, alert the King!!

The Media and the pundits have grabbed onto this one boys and gurls.  The proverbial acorn that hit Chicken Little on the head has appeared and ...... OMG, THE SKY IS FALLING!!!!!  OMG~  The Dow is down a phenomenal 89 points!  How will we recover from this humongous loss?  This is a disaster!!

Really?  REALLY?  REALLY?!?!? The Dow drops 89 points and suddenly we're running for the hills?  Suddenly global market disasters will occur?  What surprises me is not the normal media pundits grabbing onto this little item to garner much needed attention (remember insecure people always need attention).  But I am disappointed in normally sane market guru's like Peter Worden who have grabbed this ball and are running with it.  Come on, 89 points and we're all a-twitter?

Will the world stop rotating on it's axis?  Will the sun go dark? Will the market tank?  Will Wal-Mart stop paying a dividend?  Will Verizon stop generating a cell tower signal?  Will McDonald's stop flipping burgers? Perhaps in an unknown alternative universe.  But we're big boys now.  We think.  We analyze.  We play in a marketplace filled with risk on a daily basis.  We have stops in place.  (We do have stops in place don't we?)  We know how to go..... say it with me ........short!!!

Let's let saner heads prevail and actually look at the charts.  I'll use the DIA as I always do and throw up the SPY for shits and grins.  Oh, and let's not forget to look at the fear laden VIX!  First, the DIA.  Note the trendlines drawn and it is easy to see that we were a wee bit overbought.  This needed a correction to continue the uptrend.  We learned this when we studied "Trends 101".  It's basic charting!  I hope you did not learn it in the course I skipped called  "I Lost My Pants as I wasn't Paying Attention to the Trend 101"?  Remember, The Trend is Your Friend.  Investing 101.  Let's look closer at the DIA, keeping in mind that  this applies to the SPY also.
 
1. Price was hitting the top ascending tendline over and over, wanting/needing a correction.
2. Price is ABOVE the 20 EMA and the 50 SMA, two major moving averages.
3. This little drop has not violated the 20 EMA, the 50 SMA, or the bottom of the ascending channel.
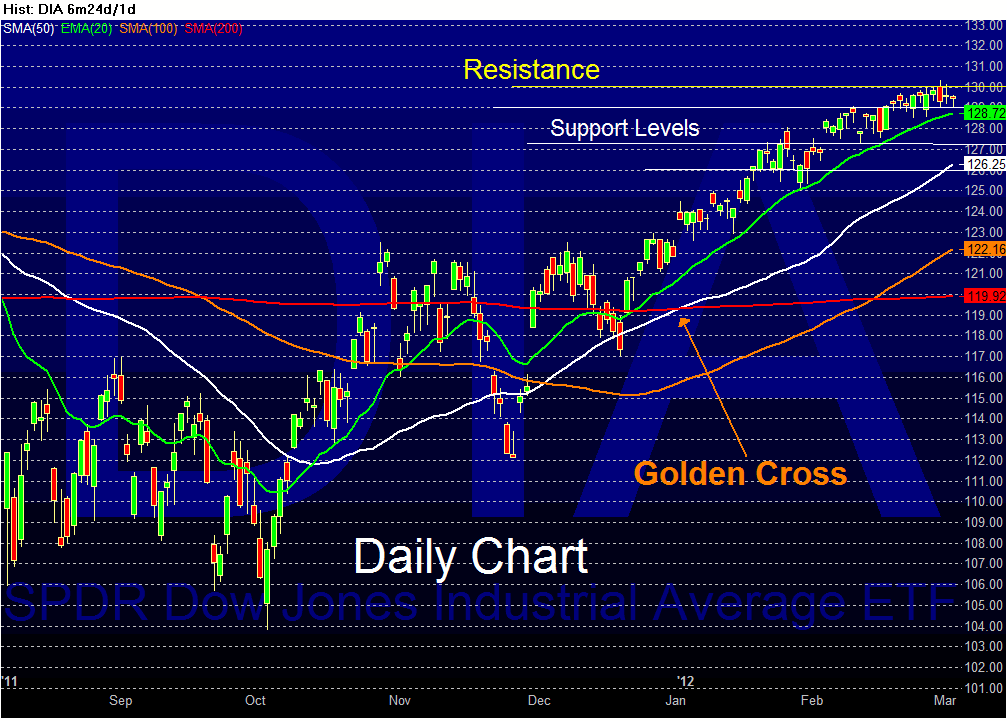
4. And while it's old news the "Golden Cross" happened when I gave a buy signal the beginning of January  (A long term signal generated by the 50 SMA crossing the 200 SMA)
5. Volume was up Friday but falls well within normal trading levels of late.  No need to get our panties in a wad here.
6. The DIA formed a bullish Hammer candlestick.  (For a description of the hammer candlestick click here)
7.  Looking back on previous moments in the last year, when Greece did not agree to harsh terms, this little downside blip is nothing compared to past drops measured in the hundreds of points.
8.  I still believe that a Greece default is essentially priced in the market already.  Yes, I could be wrong, it has, believe it or not, happened before.

The VIX.  A few pundits (Peter Worden included) have mentioned this in their commentary.  Lions and Tigers and Bears, Oh MY!  So lets' giver her a look.  After finally making it under the hallowed 20 level it has indeed "popped".  It rose to the resistance of the 50 SMA and valiantly retreated, ending the day at 20.79  Whoop de doodles!!  We are still 25% below the 25 dollar level many consider problematic and well below the 200 SMA at 26 and the 500 SMA at 23.26.  So please, let's put Henny Penny, AKA Chicken Little, back in his pen and hope another acorn doesn't fall on his head.  Nuff Said!

So what's all the hoop-la about?  As a famous wordsmith once wrote "Much Ado About Nothing~"  Yes, we too could take the position of many, looking at a very, very microscopic view and proclaim the sky is falling.  But in my world calmer heads prevail.  The uptrend is intact.  The long term trend is intact.  And as I have repeatedly said, it is my belief that Greece will default and it's baked in the pie.

Greece.  Let's talk about Greece for a moment.  A default is a given.  Private bondholders have already agreed to lose as much as 50% of the value of their bonds to avoid losing it all.  Imagine having one arm chained to a wall, a clock timer ticking away, a ravenous caged lion, and a hacksaw just within your reach.  Soon the lion will be released to tear into you as his dinner.  The clock ticks as you consider the only two possibilities.  You try everything you can imagine.  You scream.  You plead with the lion.  You try over and over to remove your arm from the chains without success.  At each turn you realize the only escape is to hack off your arm.  But the thought alone is so agonizing you cannot take action on this solution.  So you try other endless alternatives again.  You beg, you plead.  You pull trying to release your arm.  That's Greece folks.  And only one of two things can occur.  Either they will accept the bailout, cut off their arm with the hacksaw and have an orderly default, or refuse and be eaten by the lion, having a disorderly default.  Either way, it's a default.

Here's the charts with annotations for your enjoyment or lack thereof.  I'm sure you will be shocked at the amazing conclusion I have reached when you look at the trends below~

CURRENT MARKET TRENDS
Short Term (Daily Chart) – UP
Medium Term (3 day chart) – UP
Long Term (Weekly Chart) – UP


Monday, February 6, 2012

Slippin' on the Greece? No, No, No, No!

No slipping on the Greece in this little rally~!  Yes, seems even Greece, trying to throw a monkey wrench into the works, doesn't get in the way of this trend.  Yea, that's right.  Think about it.  I've said it before, Greece is gonna default!!  Arrogant little pisser.  The odds favor it.  So that is already baked into the pie folks.  Baked in, Priced in, Soon to become reality.  Count on it~  It may cause a minor blip when it happens, but I don't see more than that being caused by the eventual Slip on the Greece.

Friday's good news on the employment figures are giving us a really big heads up.  So PAY ATTENTION!  We need continued good news on that front, but I have this feeling that it is coming.  It will be a slow but sure move up, and a continued move up from here.  That's what we need to sustain the rally.

The charts are still ....... lookin' good!!  Buy or add to on pullbacks for now, as all systems are "GO"!  Below are the Daily DIA and the Daily SPY.  I added the SPY just to illustrate the inverted head and shoulders noted in a previous post before the breakout the first of January.  This is an important pattern to learn and understand.  (See 12/22/11 post titled "Bullish Inverse Head And Shoulders Alert")


CURRENT MARKET TRENDS
Short Term (Daily Chart) – UP
Medium Term (3 day chart) – UP
Long Term (Weekly Chart) – UP